


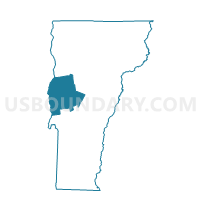
Addison County, Vermont
About
Outline

Summary
| Unique Area Identifier | 119191 |
| Name | Addison County |
| State | Vermont |
| Area (square miles) | 807.76 |
| Land Area (square miles) | 766.33 |
| Water Area (square miles) | 41.43 |
| % of Land Area | 94.87 |
| % of Water Area | 5.13 |
| Latitude of the Internal Point | 44.03124790 |
| Longtitude of the Internal Point | -73.14158070 |
| Total Population | 36,821 |
| Total Housing Units | 16,760 |
| Total Households | 14,084 |
| Median Age | 41.3 |
Maps
Graphs
Select a template below for downloading or customizing gragh for Addison County, Vermont


Neighbors
Neighoring County (by Name) Neighboring County on the Map
- Chittenden County, VT
- Essex County, NY
- Orange County, VT
- Rutland County, VT
- Washington County, NY
- Washington County, VT
- Windsor County, VT
County Subdivision in Addison County (by Name) Neighboring County Subdivision on the Map
- Addison town, Addison County, VT
- Bridport town, Addison County, VT
- Bristol town, Addison County, VT
- Cornwall town, Addison County, VT
- Ferrisburgh town, Addison County, VT
- Goshen town, Addison County, VT
- Granville town, Addison County, VT
- Hancock town, Addison County, VT
- Leicester town, Addison County, VT
- Lincoln town, Addison County, VT
- Middlebury town, Addison County, VT
- Monkton town, Addison County, VT
- New Haven town, Addison County, VT
- Orwell town, Addison County, VT
- Panton town, Addison County, VT
- Ripton town, Addison County, VT
- Salisbury town, Addison County, VT
- Shoreham town, Addison County, VT
- Starksboro town, Addison County, VT
- Vergennes city, Addison County, VT
- Waltham town, Addison County, VT
- Weybridge town, Addison County, VT
- Whiting town, Addison County, VT
Top 10 Neighboring Place (by Population) Neighboring Place on the Map
- Middlebury CDP, VT (6,588)
- Vergennes city, VT (2,588)
- Bristol CDP, VT (2,030)
- East Middlebury CDP, VT (425)
Top 10 Neighboring Elementary School District (by Population) Neighboring Elementary School District on the Map
- Middlebury Incorporated School District, VT (8,496)
- Hinesburg School District, VT (4,396)
- Brandon School District, VT (3,966)
- Bristol School District, VT (3,894)
- Charlotte School District, VT (3,754)
- Vergennes Union High School District 44, VT (3,751)
- Ferrisburg School District, VT (2,775)
- Barstow Joint Contract School District, VT (2,317)
- Monkton School District, VT (1,980)
- Huntington School District, VT (1,938)
Top 10 Neighboring Secondary School District (by Population) Neighboring Secondary School District on the Map
- Champlain Valley Union High School District 15, VT (23,992)
- Mount Mansfield Union School District 17, VT (15,226)
- Middlebury Union High School District 3, VT (14,721)
- Harwood Union High School District 19, VT (12,836)
- Fair Haven Union High School District 16, VT (10,727)
- Mount Abraham Union High School District 28, VT (10,649)
- Otter Valley Union High School District 8, VT (9,200)
- Vergennes Union High School District 5, VT (7,897)
- Randolph Union High School District 2, VT (7,316)
- Chittenden School District, VT (1,258)
Top 10 Neighboring Unified School District (by Population) Neighboring Unified School District on the Map
- Ticonderoga Central School District, NY (5,687)
- Moriah Central School District, NY (4,797)
- Willsboro Central School District, NY (2,598)
- Crown Point Central School District, NY (2,011)
- Westport Central School District, NY (1,408)
- Rochester School District, VT (1,139)
- Putnam Central School District, NY (650)
- Hancock School District, VT (323)
- Granville School District, VT (298)
- Buels Gore School District, VT (30)
Top 10 Neighboring State Legislative District Lower Chamber (by Population) Neighboring State Legislative District Lower Chamber on the Map
- Assembly District 112, NY (139,495)
- Assembly District 113, NY (135,737)
- Addison-4 State House District, VT (8,922)
- Washington-2 State House District, VT (8,556)
- Addison-1 State House District, VT (8,496)
- Washington-Chittenden-1 State House District, VT (8,369)
- Addison-3 State House District, VT (7,897)
- Orange-Addison-1 State House District, VT (7,614)
- Washington-1 State House District, VT (4,777)
- Addison-2 State House District, VT (4,496)
Top 10 Neighboring State Legislative District Upper Chamber (by Population) Neighboring State Legislative District Upper Chamber on the Map
- State Senate District 45, NY (306,856)
- Chittenden State Senate District, VT (139,478)
- Washington State Senate District, VT (59,534)
- Rutland State Senate District, VT (57,676)
- Windsor State Senate District, VT (56,670)
- Addison State Senate District, VT (40,787)
- Orange State Senate District, VT (20,049)
Top 10 Neighboring 111th Congressional District (by Population) Neighboring 111th Congressional District on the Map
- Congressional District 20, NY (683,198)
- Congressional District 23, NY (664,245)
- Congressional District (at Large), VT (625,741)
Top 10 Census Tract in Addison County (by Population) Neighboring Census Tract on the Map
- Census Tract 9609, Addison County, VT (5,337)
- Census Tract 9604, Addison County, VT (5,094)
- Census Tract 9608, Addison County, VT (4,539)
- Census Tract 9607, Addison County, VT (3,957)
- Census Tract 9605, Addison County, VT (3,894)
- Census Tract 9601, Addison County, VT (3,757)
- Census Tract 9602, Addison County, VT (2,775)
- Census Tract 9606, Addison County, VT (2,644)
- Census Tract 9603, Addison County, VT (2,588)
- Census Tract 9610, Addison County, VT (2,236)
Top 10 Neighboring 5-Digit ZIP Code Tabulation Area (by Population) Neighboring 5-Digit ZIP Code Tabulation Area on the Map
- 05753, VT (10,491)
- 05443, VT (6,656)
- 05491, VT (5,909)
- 05733, VT (5,895)
- 05461, VT (4,542)
- 05060, VT (4,415)
- 05743, VT (4,330)
- 05445, VT (3,754)
- 05763, VT (2,747)
- 05673, VT (2,574)
Data
Demographic, Population, Households, and Housing Units
** Data sources from census 2010 **
Show Data on Map
Download Full List as CSV
Download Quick Sheet as CSV
| Subject | This Area | Vermont | National |
|---|---|---|---|
| POPULATION | |||
| Total Population Map | 36,821 | 625,741 | 308,745,538 |
| POPULATION, HISPANIC OR LATINO ORIGIN | |||
| Not Hispanic or Latino Map | 36,136 | 616,533 | 258,267,944 |
| Hispanic or Latino Map | 685 | 9,208 | 50,477,594 |
| POPULATION, RACE | |||
| White alone Map | 35,078 | 596,292 | 223,553,265 |
| Black or African American alone Map | 283 | 6,277 | 38,929,319 |
| American Indian and Alaska Native alone Map | 88 | 2,207 | 2,932,248 |
| Asian alone Map | 532 | 7,947 | 14,674,252 |
| Native Hawaiian and Other Pacific Islander alone Map | 6 | 160 | 540,013 |
| Some Other Race alone Map | 202 | 2,105 | 19,107,368 |
| Two or More Races Map | 632 | 10,753 | 9,009,073 |
| POPULATION, SEX | |||
| Male Map | 18,364 | 308,206 | 151,781,326 |
| Female Map | 18,457 | 317,535 | 156,964,212 |
| POPULATION, AGE (18 YEARS) | |||
| 18 years and over Map | 29,319 | 496,508 | 234,564,071 |
| Under 18 years | 7,502 | 129,233 | 74,181,467 |
| POPULATION, AGE | |||
| Under 5 years | 1,772 | 31,952 | 20,201,362 |
| 5 to 9 years | 1,923 | 34,654 | 20,348,657 |
| 10 to 14 years | 2,246 | 37,637 | 20,677,194 |
| 15 to 17 years | 1,561 | 24,990 | 12,954,254 |
| 18 and 19 years | 1,725 | 21,022 | 9,086,089 |
| 20 years | 854 | 10,433 | 4,519,129 |
| 21 years | 804 | 9,651 | 4,354,294 |
| 22 to 24 years | 1,411 | 23,767 | 12,712,576 |
| 25 to 29 years | 1,624 | 35,441 | 21,101,849 |
| 30 to 34 years | 1,778 | 34,181 | 19,962,099 |
| 35 to 39 years | 2,051 | 36,358 | 20,179,642 |
| 40 to 44 years | 2,508 | 42,001 | 20,890,964 |
| 45 to 49 years | 2,968 | 50,110 | 22,708,591 |
| 50 to 54 years | 3,057 | 52,493 | 22,298,125 |
| 55 to 59 years | 2,932 | 48,739 | 19,664,805 |
| 60 and 61 years | 1,088 | 17,634 | 7,113,727 |
| 62 to 64 years | 1,417 | 23,600 | 9,704,197 |
| 65 and 66 years | 755 | 12,819 | 5,319,902 |
| 67 to 69 years | 948 | 16,571 | 7,115,361 |
| 70 to 74 years | 1,123 | 20,148 | 9,278,166 |
| 75 to 79 years | 849 | 15,960 | 7,317,795 |
| 80 to 84 years | 704 | 12,783 | 5,743,327 |
| 85 years and over | 723 | 12,797 | 5,493,433 |
| MEDIAN AGE BY SEX | |||
| Both sexes Map | 41.30 | 41.50 | 37.20 |
| Male Map | 40.20 | 40.40 | 35.80 |
| Female Map | 42.30 | 42.70 | 38.50 |
| HOUSEHOLDS | |||
| Total Households Map | 14,084 | 256,442 | 116,716,292 |
| HOUSEHOLDS, HOUSEHOLD TYPE | |||
| Family households: Map | 9,340 | 160,360 | 77,538,296 |
| Husband-wife family Map | 7,510 | 124,395 | 56,510,377 |
| Other family: Map | 1,830 | 35,965 | 21,027,919 |
| Male householder, no wife present Map | 612 | 11,326 | 5,777,570 |
| Female householder, no husband present Map | 1,218 | 24,639 | 15,250,349 |
| Nonfamily households: Map | 4,744 | 96,082 | 39,177,996 |
| Householder living alone Map | 3,589 | 72,233 | 31,204,909 |
| Householder not living alone Map | 1,155 | 23,849 | 7,973,087 |
| HOUSEHOLDS, HISPANIC OR LATINO ORIGIN OF HOUSEHOLDER | |||
| Not Hispanic or Latino householder: Map | 13,941 | 253,871 | 103,254,926 |
| Hispanic or Latino householder: Map | 143 | 2,571 | 13,461,366 |
| HOUSEHOLDS, RACE OF HOUSEHOLDER | |||
| Householder who is White alone | 13,756 | 248,163 | 89,754,352 |
| Householder who is Black or African American alone | 27 | 1,594 | 14,129,983 |
| Householder who is American Indian and Alaska Native alone | 40 | 912 | 939,707 |
| Householder who is Asian alone | 73 | 2,077 | 4,632,164 |
| Householder who is Native Hawaiian and Other Pacific Islander alone | 0 | 48 | 143,932 |
| Householder who is Some Other Race alone | 39 | 554 | 4,916,427 |
| Householder who is Two or More Races | 149 | 3,094 | 2,199,727 |
| HOUSEHOLDS, HOUSEHOLD TYPE BY HOUSEHOLD SIZE | |||
| Family households: Map | 9,340 | 160,360 | 77,538,296 |
| 2-person household Map | 4,476 | 77,346 | 31,882,616 |
| 3-person household Map | 2,069 | 36,988 | 17,765,829 |
| 4-person household Map | 1,811 | 30,093 | 15,214,075 |
| 5-person household Map | 674 | 10,783 | 7,411,997 |
| 6-person household Map | 212 | 3,381 | 3,026,278 |
| 7-or-more-person household Map | 98 | 1,769 | 2,237,501 |
| Nonfamily households: Map | 4,744 | 96,082 | 39,177,996 |
| 1-person household Map | 3,589 | 72,233 | 31,204,909 |
| 2-person household Map | 991 | 19,543 | 6,360,012 |
| 3-person household Map | 96 | 2,707 | 992,156 |
| 4-person household Map | 48 | 1,117 | 411,171 |
| 5-person household Map | 14 | 324 | 126,634 |
| 6-person household Map | 1 | 99 | 48,421 |
| 7-or-more-person household Map | 5 | 59 | 34,693 |
| HOUSING UNITS | |||
| Total Housing Units Map | 16,760 | 322,539 | 131,704,730 |
| HOUSING UNITS, OCCUPANCY STATUS | |||
| Occupied Map | 14,084 | 256,442 | 116,716,292 |
| Vacant Map | 2,676 | 66,097 | 14,988,438 |
| HOUSING UNITS, OCCUPIED, TENURE | |||
| Owned with a mortgage or a loan Map | 7,279 | 123,593 | 52,979,430 |
| Owned free and clear Map | 3,383 | 57,814 | 23,006,644 |
| Renter occupied Map | 3,422 | 75,035 | 40,730,218 |
| HOUSING UNITS, VACANT, VACANCY STATUS | |||
| For rent Map | 241 | 5,635 | 4,137,567 |
| Rented, not occupied Map | 36 | 597 | 206,825 |
| For sale only Map | 181 | 3,598 | 1,896,796 |
| Sold, not occupied Map | 45 | 615 | 421,032 |
| For seasonal, recreational, or occasional use Map | 1,834 | 50,198 | 4,649,298 |
| For migrant workers Map | 10 | 39 | 24,161 |
| Other vacant Map | 329 | 5,415 | 3,652,759 |
| HOUSING UNITS, OCCUPIED, AVERAGE HOUSEHOLD SIZE BY TENURE | |||
| Total: Map | 2.41 | 2.34 | 2.58 |
| Owner occupied Map | 2.49 | 2.45 | 2.65 |
| Renter occupied Map | 2.15 | 2.08 | 2.44 |
| HOUSING UNITS, OCCUPIED, TENURE BY RACE OF HOUSEHOLDER | |||
| Owner occupied: Map | 10,662 | 181,407 | 75,986,074 |
| Householder who is White alone Map | 10,498 | 177,587 | 63,446,275 |
| Householder who is Black or African American alone Map | 18 | 455 | 6,261,464 |
| Householder who is American Indian and Alaska Native alone Map | 23 | 477 | 509,588 |
| Householder who is Asian alone Map | 32 | 1,070 | 2,688,861 |
| Householder who is Native Hawaiian and Other Pacific Islander alone Map | 0 | 21 | 61,911 |
| Householder who is Some Other Race alone Map | 10 | 206 | 1,975,817 |
| Householder who is Two or More Races Map | 81 | 1,591 | 1,042,158 |
| Renter occupied: Map | 3,422 | 75,035 | 40,730,218 |
| Householder who is White alone Map | 3,258 | 70,576 | 26,308,077 |
| Householder who is Black or African American alone Map | 9 | 1,139 | 7,868,519 |
| Householder who is American Indian and Alaska Native alone Map | 17 | 435 | 430,119 |
| Householder who is Asian alone Map | 41 | 1,007 | 1,943,303 |
| Householder who is Native Hawaiian and Other Pacific Islander alone Map | 0 | 27 | 82,021 |
| Householder who is Some Other Race alone Map | 29 | 348 | 2,940,610 |
| Householder who is Two or More Races Map | 68 | 1,503 | 1,157,569 |
| HOUSING UNITS, OCCUPIED, TENURE BY HISPANIC OR LATINO ORIGIN OF HOUSEHOLDER | |||
| Owner occupied: Map | 10,662 | 181,407 | 75,986,074 |
| Not Hispanic or Latino householder Map | 10,603 | 180,120 | 69,617,625 |
| Hispanic or Latino householder Map | 59 | 1,287 | 6,368,449 |
| Renter occupied: Map | 3,422 | 75,035 | 40,730,218 |
| Not Hispanic or Latino householder Map | 3,338 | 73,751 | 33,637,301 |
| Hispanic or Latino householder Map | 84 | 1,284 | 7,092,917 |
| HOUSING UNITS, OCCUPIED, TENURE BY HOUSEHOLD SIZE | |||
| Owner occupied: Map | 10,662 | 181,407 | 75,986,074 |
| 1-person household Map | 2,193 | 39,950 | 16,453,569 |
| 2-person household Map | 4,464 | 75,142 | 27,618,605 |
| 3-person household Map | 1,700 | 29,326 | 12,517,563 |
| 4-person household Map | 1,523 | 24,668 | 10,998,793 |
| 5-person household Map | 539 | 8,425 | 5,057,765 |
| 6-person household Map | 164 | 2,562 | 1,965,796 |
| 7-or-more-person household Map | 79 | 1,334 | 1,373,983 |
| Renter occupied: Map | 3,422 | 75,035 | 40,730,218 |
| 1-person household Map | 1,396 | 32,283 | 14,751,340 |
| 2-person household Map | 1,003 | 21,747 | 10,624,023 |
| 3-person household Map | 465 | 10,369 | 6,240,422 |
| 4-person household Map | 336 | 6,542 | 4,626,453 |
| 5-person household Map | 149 | 2,682 | 2,480,866 |
| 6-person household Map | 49 | 918 | 1,108,903 |
| 7-or-more-person household Map | 24 | 494 | 898,211 |
Loading...