


Riverside County, California
About
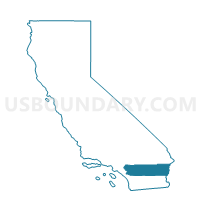
Outline

Summary
| Unique Area Identifier | 121598 |
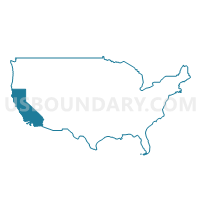
| Name | Riverside County |
| State | California |
| Area (square miles) | 7,303.42 |
| Land Area (square miles) | 7,206.48 |
| Water Area (square miles) | 96.94 |
| % of Land Area | 98.67 |
| % of Water Area | 1.33 |
| Latitude of the Internal Point | 33.72982750 |
| Longtitude of the Internal Point | -116.00223890 |
| Total Population | 2,189,641 |
| Total Housing Units | 800,707 |
| Total Households | 686,260 |
| Median Age | 33.7 |
Maps
Graphs
Select a template below for downloading or customizing gragh for Riverside County, California


Neighbors
Neighoring County (by Name) Neighboring County on the Map
- Imperial County, CA
- La Paz County, AZ
- Orange County, CA
- San Bernardino County, CA
- San Diego County, CA
County Subdivision in Riverside County (by Name) Neighboring County Subdivision on the Map
- Blythe CCD, Riverside County, CA
- Cathedral City-Palm Desert CCD, Riverside County, CA
- Chuckwalla Valley CCD, Riverside County, CA
- Coachella Valley CCD, Riverside County, CA
- Corona CCD, Riverside County, CA
- Desert Hot Springs CCD, Riverside County, CA
- Elsinore Valley CCD, Riverside County, CA
- Hemet-San Jacinto CCD, Riverside County, CA
- Idyllwild CCD, Riverside County, CA
- Jurupa CCD, Riverside County, CA
- Lake Mathews CCD, Riverside County, CA
- Murrieta CCD, Riverside County, CA
- Norco CCD, Riverside County, CA
- Palm Springs CCD, Riverside County, CA
- Perris Valley CCD, Riverside County, CA
- Riverside CCD, Riverside County, CA
- San Gorgonio Pass CCD, Riverside County, CA
Top 10 Neighboring Place (by Population) Neighboring Place on the Map
- Anaheim city, CA (336,265)
- Riverside city, CA (303,871)
- Fontana city, CA (196,069)
- Moreno Valley city, CA (193,365)
- Ontario city, CA (163,924)
- Corona city, CA (152,374)
- Murrieta city, CA (103,466)
- Temecula city, CA (100,097)
- Rialto city, CA (99,171)
- Hemet city, CA (78,657)
Top 10 Neighboring Elementary School District (by Population) Neighboring Elementary School District on the Map
- Menifee Union Elementary School District, CA (78,408)
- Fallbrook Union Elementary School District, CA (60,442)
- Perris Elementary School District, CA (47,013)
- Cucamonga Elementary School District, CA (27,185)
- Romoland Elementary School District, CA (24,195)
- Mountain View Elementary School District, CA (19,733)
- Nuview Union Elementary School District, CA (9,846)
- Quartzsite Elementary District, AZ (6,162)
- Vallecitos Elementary School District, CA (2,162)
- Magnolia Union Elementary School District, CA (181)
Top 10 Neighboring Secondary School District (by Population) Neighboring Secondary School District on the Map
- Chaffey Joint Union High School District, CA (396,129)
- Perris Union High School District, CA (159,462)
- Fallbrook Union High School District, CA (79,673)
- Brawley Union High School District, CA (28,597)
- Bicentennial Union High School District, AZ (10,921)
Top 10 Neighboring Unified School District (by Population) Neighboring Unified School District on the Map
- Capistrano Unified School District, CA (343,291)
- Corona-Norco Unified School District, CA (256,162)
- Riverside Unified School District, CA (245,292)
- Orange Unified School District, CA (218,176)
- Saddleback Valley Unified School District, CA (205,432)
- Desert Sands Unified School District, CA (177,301)
- Fontana Unified School District, CA (176,626)
- Chino Valley Unified School District, CA (172,848)
- Moreno Valley Unified School District, CA (167,663)
- Palm Springs Unified School District, CA (164,720)
Top 10 Neighboring State Legislative District Lower Chamber (by Population) Neighboring State Legislative District Lower Chamber on the Map
- Assembly District 65, CA (611,978)
- Assembly District 64, CA (583,532)
- Assembly District 66, CA (566,937)
- Assembly District 80, CA (546,875)
- Assembly District 71, CA (543,864)
- Assembly District 63, CA (514,285)
- Assembly District 62, CA (488,817)
- Assembly District 34, CA (487,193)
- Assembly District 77, CA (444,726)
- Assembly District 73, CA (444,315)
Top 10 Neighboring State Legislative District Upper Chamber (by Population) Neighboring State Legislative District Upper Chamber on the Map
- State Senate District 37, CA (1,215,876)
- State Senate District 18, CA (1,048,811)
- State Senate District 36, CA (1,036,001)
- State Senate District 40, CA (1,018,606)
- State Senate District 31, CA (989,662)
- State Senate District 38, CA (973,002)
- State Senate District 32, CA (946,010)
- State Senate District 33, CA (936,082)
- State Senate District 29, CA (881,748)
- State Senate District 24, AZ (207,694)
Top 10 Neighboring 111th Congressional District (by Population) Neighboring 111th Congressional District on the Map
- Congressional District 45, CA (914,209)
- Congressional District 7, AZ (855,769)
- Congressional District 44, CA (844,756)
- Congressional District 49, CA (797,428)
- Congressional District 41, CA (797,133)
- Congressional District 51, CA (757,891)
- Congressional District 43, CA (735,581)
- Congressional District 52, CA (673,893)
- Congressional District 42, CA (667,638)
Top 10 Census Tract in Riverside County (by Population) Neighboring Census Tract on the Map
- Census Tract 414.09, Riverside County, CA (14,898)
- Census Tract 456.04, Riverside County, CA (13,694)
- Census Tract 505, Riverside County, CA (13,261)
- Census Tract 406.13, Riverside County, CA (12,842)
- Census Tract 427.15, Riverside County, CA (12,805)
- Census Tract 479, Riverside County, CA (11,611)
- Census Tract 426.17, Riverside County, CA (11,436)
- Census Tract 426.19, Riverside County, CA (11,267)
- Census Tract 503, Riverside County, CA (11,161)
- Census Tract 456.05, Riverside County, CA (10,543)
Top 10 Neighboring 5-Digit ZIP Code Tabulation Area (by Population) Neighboring 5-Digit ZIP Code Tabulation Area on the Map
- 92503, CA (84,519)
- 91710, CA (80,358)
- 92509, CA (75,196)
- 91709, CA (74,796)
- 92553, CA (73,722)
- 92592, CA (72,492)
- 92882, CA (67,917)
- 92562, CA (62,079)
- 92201, CA (61,827)
- 92880, CA (58,763)
Data
Demographic, Population, Households, and Housing Units
** Data sources from census 2010 **
Show Data on Map
Download Full List as CSV
Download Quick Sheet as CSV
| Subject | This Area | California | National |
|---|---|---|---|
| POPULATION | |||
| Total Population Map | 2,189,641 | 37,253,956 | 308,745,538 |
| POPULATION, HISPANIC OR LATINO ORIGIN | |||
| Not Hispanic or Latino Map | 1,194,384 | 23,240,237 | 258,267,944 |
| Hispanic or Latino Map | 995,257 | 14,013,719 | 50,477,594 |
| POPULATION, RACE | |||
| White alone Map | 1,335,147 | 21,453,934 | 223,553,265 |
| Black or African American alone Map | 140,543 | 2,299,072 | 38,929,319 |
| American Indian and Alaska Native alone Map | 23,710 | 362,801 | 2,932,248 |
| Asian alone Map | 130,468 | 4,861,007 | 14,674,252 |
| Native Hawaiian and Other Pacific Islander alone Map | 6,874 | 144,386 | 540,013 |
| Some Other Race alone Map | 448,235 | 6,317,372 | 19,107,368 |
| Two or More Races Map | 104,664 | 1,815,384 | 9,009,073 |
| POPULATION, SEX | |||
| Male Map | 1,089,576 | 18,517,830 | 151,781,326 |
| Female Map | 1,100,065 | 18,736,126 | 156,964,212 |
| POPULATION, AGE (18 YEARS) | |||
| 18 years and over Map | 1,569,533 | 27,958,916 | 234,564,071 |
| Under 18 years | 620,108 | 9,295,040 | 74,181,467 |
| POPULATION, AGE | |||
| Under 5 years | 162,438 | 2,531,333 | 20,201,362 |
| 5 to 9 years | 167,065 | 2,505,839 | 20,348,657 |
| 10 to 14 years | 177,644 | 2,590,930 | 20,677,194 |
| 15 to 17 years | 112,961 | 1,666,938 | 12,954,254 |
| 18 and 19 years | 74,164 | 1,157,002 | 9,086,089 |
| 20 years | 33,944 | 573,642 | 4,519,129 |
| 21 years | 32,109 | 555,775 | 4,354,294 |
| 22 to 24 years | 88,519 | 1,636,532 | 12,712,576 |
| 25 to 29 years | 143,992 | 2,744,409 | 21,101,849 |
| 30 to 34 years | 138,437 | 2,573,468 | 19,962,099 |
| 35 to 39 years | 143,926 | 2,573,579 | 20,179,642 |
| 40 to 44 years | 149,379 | 2,609,131 | 20,890,964 |
| 45 to 49 years | 152,722 | 2,689,819 | 22,708,591 |
| 50 to 54 years | 140,016 | 2,562,552 | 22,298,125 |
| 55 to 59 years | 114,765 | 2,204,296 | 19,664,805 |
| 60 and 61 years | 41,181 | 786,276 | 7,113,727 |
| 62 to 64 years | 57,793 | 1,045,921 | 9,704,197 |
| 65 and 66 years | 33,549 | 568,817 | 5,319,902 |
| 67 to 69 years | 44,946 | 734,741 | 7,115,361 |
| 70 to 74 years | 62,103 | 971,778 | 9,278,166 |
| 75 to 79 years | 49,003 | 766,971 | 7,317,795 |
| 80 to 84 years | 36,793 | 603,239 | 5,743,327 |
| 85 years and over | 32,192 | 600,968 | 5,493,433 |
| MEDIAN AGE BY SEX | |||
| Both sexes Map | 33.70 | 35.20 | 37.20 |
| Male Map | 32.70 | 34.00 | 35.80 |
| Female Map | 34.60 | 36.30 | 38.50 |
| HOUSEHOLDS | |||
| Total Households Map | 686,260 | 12,577,498 | 116,716,292 |
| HOUSEHOLDS, HOUSEHOLD TYPE | |||
| Family households: Map | 510,241 | 8,642,473 | 77,538,296 |
| Husband-wife family Map | 376,381 | 6,213,310 | 56,510,377 |
| Other family: Map | 133,860 | 2,429,163 | 21,027,919 |
| Male householder, no wife present Map | 42,845 | 752,347 | 5,777,570 |
| Female householder, no husband present Map | 91,015 | 1,676,816 | 15,250,349 |
| Nonfamily households: Map | 176,019 | 3,935,025 | 39,177,996 |
| Householder living alone Map | 132,494 | 2,929,442 | 31,204,909 |
| Householder not living alone Map | 43,525 | 1,005,583 | 7,973,087 |
| HOUSEHOLDS, HISPANIC OR LATINO ORIGIN OF HOUSEHOLDER | |||
| Not Hispanic or Latino householder: Map | 459,684 | 9,192,322 | 103,254,926 |
| Hispanic or Latino householder: Map | 226,576 | 3,385,176 | 13,461,366 |
| HOUSEHOLDS, RACE OF HOUSEHOLDER | |||
| Householder who is White alone | 471,474 | 8,129,331 | 89,754,352 |
| Householder who is Black or African American alone | 45,128 | 835,651 | 14,129,983 |
| Householder who is American Indian and Alaska Native alone | 7,259 | 113,235 | 939,707 |
| Householder who is Asian alone | 36,752 | 1,529,789 | 4,632,164 |
| Householder who is Native Hawaiian and Other Pacific Islander alone | 1,733 | 38,238 | 143,932 |
| Householder who is Some Other Race alone | 102,597 | 1,497,993 | 4,916,427 |
| Householder who is Two or More Races | 21,317 | 433,261 | 2,199,727 |
| HOUSEHOLDS, HOUSEHOLD TYPE BY HOUSEHOLD SIZE | |||
| Family households: Map | 510,241 | 8,642,473 | 77,538,296 |
| 2-person household Map | 160,534 | 2,887,696 | 31,882,616 |
| 3-person household Map | 99,313 | 1,904,697 | 17,765,829 |
| 4-person household Map | 106,418 | 1,823,355 | 15,214,075 |
| 5-person household Map | 70,685 | 1,018,257 | 7,411,997 |
| 6-person household Map | 36,859 | 497,773 | 3,026,278 |
| 7-or-more-person household Map | 36,432 | 510,695 | 2,237,501 |
| Nonfamily households: Map | 176,019 | 3,935,025 | 39,177,996 |
| 1-person household Map | 132,494 | 2,929,442 | 31,204,909 |
| 2-person household Map | 33,915 | 766,106 | 6,360,012 |
| 3-person household Map | 5,328 | 139,115 | 992,156 |
| 4-person household Map | 2,413 | 60,096 | 411,171 |
| 5-person household Map | 1,018 | 22,151 | 126,634 |
| 6-person household Map | 478 | 9,698 | 48,421 |
| 7-or-more-person household Map | 373 | 8,417 | 34,693 |
| HOUSING UNITS | |||
| Total Housing Units Map | 800,707 | 13,680,081 | 131,704,730 |
| HOUSING UNITS, OCCUPANCY STATUS | |||
| Occupied Map | 686,260 | 12,577,498 | 116,716,292 |
| Vacant Map | 114,447 | 1,102,583 | 14,988,438 |
| HOUSING UNITS, OCCUPIED, TENURE | |||
| Owned with a mortgage or a loan Map | 363,460 | 5,465,345 | 52,979,430 |
| Owned free and clear Map | 98,752 | 1,570,026 | 23,006,644 |
| Renter occupied Map | 224,048 | 5,542,127 | 40,730,218 |
| HOUSING UNITS, VACANT, VACANCY STATUS | |||
| For rent Map | 23,547 | 374,610 | 4,137,567 |
| Rented, not occupied Map | 1,107 | 20,347 | 206,825 |
| For sale only Map | 18,417 | 154,775 | 1,896,796 |
| Sold, not occupied Map | 3,255 | 34,288 | 421,032 |
| For seasonal, recreational, or occasional use Map | 50,538 | 302,815 | 4,649,298 |
| For migrant workers Map | 84 | 2,100 | 24,161 |
| Other vacant Map | 17,499 | 213,648 | 3,652,759 |
| HOUSING UNITS, OCCUPIED, AVERAGE HOUSEHOLD SIZE BY TENURE | |||
| Total: Map | 3.14 | 2.90 | 2.58 |
| Owner occupied Map | 3.10 | 2.95 | 2.65 |
| Renter occupied Map | 3.22 | 2.83 | 2.44 |
| HOUSING UNITS, OCCUPIED, TENURE BY RACE OF HOUSEHOLDER | |||
| Owner occupied: Map | 462,212 | 7,035,371 | 75,986,074 |
| Householder who is White alone Map | 339,477 | 4,996,053 | 63,446,275 |
| Householder who is Black or African American alone Map | 23,034 | 310,834 | 6,261,464 |
| Householder who is American Indian and Alaska Native alone Map | 4,379 | 52,963 | 509,588 |
| Householder who is Asian alone Map | 26,410 | 878,924 | 2,688,861 |
| Householder who is Native Hawaiian and Other Pacific Islander alone Map | 903 | 16,570 | 61,911 |
| Householder who is Some Other Race alone Map | 55,734 | 589,196 | 1,975,817 |
| Householder who is Two or More Races Map | 12,275 | 190,831 | 1,042,158 |
| Renter occupied: Map | 224,048 | 5,542,127 | 40,730,218 |
| Householder who is White alone Map | 131,997 | 3,133,278 | 26,308,077 |
| Householder who is Black or African American alone Map | 22,094 | 524,817 | 7,868,519 |
| Householder who is American Indian and Alaska Native alone Map | 2,880 | 60,272 | 430,119 |
| Householder who is Asian alone Map | 10,342 | 650,865 | 1,943,303 |
| Householder who is Native Hawaiian and Other Pacific Islander alone Map | 830 | 21,668 | 82,021 |
| Householder who is Some Other Race alone Map | 46,863 | 908,797 | 2,940,610 |
| Householder who is Two or More Races Map | 9,042 | 242,430 | 1,157,569 |
| HOUSING UNITS, OCCUPIED, TENURE BY HISPANIC OR LATINO ORIGIN OF HOUSEHOLDER | |||
| Owner occupied: Map | 462,212 | 7,035,371 | 75,986,074 |
| Not Hispanic or Latino householder Map | 330,149 | 5,529,138 | 69,617,625 |
| Hispanic or Latino householder Map | 132,063 | 1,506,233 | 6,368,449 |
| Renter occupied: Map | 224,048 | 5,542,127 | 40,730,218 |
| Not Hispanic or Latino householder Map | 129,535 | 3,663,184 | 33,637,301 |
| Hispanic or Latino householder Map | 94,513 | 1,878,943 | 7,092,917 |
| HOUSING UNITS, OCCUPIED, TENURE BY HOUSEHOLD SIZE | |||
| Owner occupied: Map | 462,212 | 7,035,371 | 75,986,074 |
| 1-person household Map | 81,001 | 1,340,915 | 16,453,569 |
| 2-person household Map | 146,342 | 2,269,063 | 27,618,605 |
| 3-person household Map | 68,959 | 1,164,562 | 12,517,563 |
| 4-person household Map | 73,374 | 1,129,739 | 10,998,793 |
| 5-person household Map | 46,032 | 577,673 | 5,057,765 |
| 6-person household Map | 23,756 | 273,058 | 1,965,796 |
| 7-or-more-person household Map | 22,748 | 280,361 | 1,373,983 |
| Renter occupied: Map | 224,048 | 5,542,127 | 40,730,218 |
| 1-person household Map | 51,493 | 1,588,527 | 14,751,340 |
| 2-person household Map | 48,107 | 1,384,739 | 10,624,023 |
| 3-person household Map | 35,682 | 879,250 | 6,240,422 |
| 4-person household Map | 35,457 | 753,712 | 4,626,453 |
| 5-person household Map | 25,671 | 462,735 | 2,480,866 |
| 6-person household Map | 13,581 | 234,413 | 1,108,903 |
| 7-or-more-person household Map | 14,057 | 238,751 | 898,211 |
Loading...