


Lee County, Illinois
About
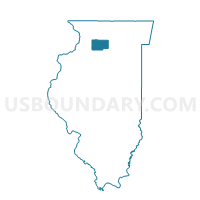
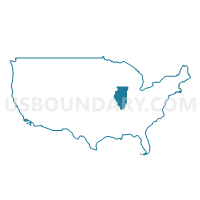
Outline

Summary
| Unique Area Identifier | 122196 |
| Name | Lee County |
| State | Illinois |
| Area (square miles) | 728.95 |
| Land Area (square miles) | 724.90 |
| Water Area (square miles) | 4.06 |
| % of Land Area | 99.44 |
| % of Water Area | 0.56 |
| Latitude of the Internal Point | 41.74744190 |
| Longtitude of the Internal Point | -89.29935050 |
| Total Population | 36,031 |
| Total Housing Units | 15,049 |
| Total Households | 13,758 |
| Median Age | 42 |
Maps
Graphs
Select a template below for downloading or customizing gragh for Lee County, Illinois


Neighbors
Neighoring County (by Name) Neighboring County on the Map
County Subdivision in Lee County (by Name) Neighboring County Subdivision on the Map
- Alto township, Lee County, IL
- Amboy township, Lee County, IL
- Ashton township, Lee County, IL
- Bradford township, Lee County, IL
- Brooklyn township, Lee County, IL
- Dixon township, Lee County, IL
- East Grove township, Lee County, IL
- Franklin Grove township, Lee County, IL
- Hamilton township, Lee County, IL
- Harmon township, Lee County, IL
- Lee Center township, Lee County, IL
- Marion township, Lee County, IL
- May township, Lee County, IL
- Nachusa township, Lee County, IL
- Nelson township, Lee County, IL
- Palmyra township, Lee County, IL
- Reynolds township, Lee County, IL
- South Dixon township, Lee County, IL
- Sublette township, Lee County, IL
- Viola township, Lee County, IL
- Willow Creek township, Lee County, IL
- Wyoming township, Lee County, IL
Top 10 Neighboring Place (by Population) Neighboring Place on the Map
- Dixon city, IL (15,733)
- Rochelle city, IL (9,574)
- Amboy city, IL (2,500)
- Franklin Grove village, IL (1,021)
- Ashton village, IL (972)
- Paw Paw village, IL (870)
- Lost Nation CDP, IL (708)
- Sublette village, IL (449)
- Grand Detour CDP, IL (429)
- Lee village, IL (337)
Top 10 Neighboring Elementary School District (by Population) Neighboring Elementary School District on the Map
- Rochelle Community Consolidated District 231, IL (13,647)
- Mendota Community Consolidated School District 289, IL (10,782)
- Montmorency Community Consolidated School District 145, IL (2,603)
- East Coloma School District 12, IL (2,582)
- Creston Community Consolidated School District 161, IL (959)
- Ohio Community Consolidated School District 17, IL (830)
- Steward Elementary School District 220, IL (626)
- Nelson Public School District 8, IL (358)
Top 10 Neighboring Secondary School District (by Population) Neighboring Secondary School District on the Map
- Rochelle Township High School District 212, IL (17,129)
- Rock Falls Township High School District 301, IL (14,605)
- Mendota Township High School District 280, IL (10,823)
- Ohio Community High School District 505, IL (839)
Top 10 Neighboring Unified School District (by Population) Neighboring Unified School District on the Map
- DeKalb Community Unit School District 428, IL (52,734)
- Dixon Unit School District 170, IL (23,163)
- Sterling Community Unit District 5, IL (22,066)
- Bureau Valley Community Unit School District 340, IL (6,788)
- Prophetstown-Lyndon-Tampico Community Unit School District 3, IL (5,781)
- Amboy Community Unit School District 272, IL (5,261)
- Indian Creek Community Unit District 425, IL (4,690)
- Polo Community Unit School District 222, IL (4,141)
- Ashton Community Unit School District 275, IL (3,894)
- Earlville Community Unit School District 9, IL (2,708)
Top 10 Neighboring State Legislative District Lower Chamber (by Population) Neighboring State Legislative District Lower Chamber on the Map
- State House District 70, IL (121,976)
- State House District 76, IL (105,699)
- State House District 90, IL (103,604)
- State House District 74, IL (100,949)
Top 10 Neighboring State Legislative District Upper Chamber (by Population) Neighboring State Legislative District Upper Chamber on the Map
- State Senate District 35, IL (245,609)
- State Senate District 38, IL (231,284)
- State Senate District 37, IL (218,476)
- State Senate District 45, IL (209,870)
Top 10 Neighboring 111th Congressional District (by Population) Neighboring 111th Congressional District on the Map
- Congressional District 14, IL (840,956)
- Congressional District 11, IL (759,445)
- Congressional District 16, IL (718,791)
Top 10 Census Tract in Lee County (by Population) Neighboring Census Tract on the Map
- Census Tract 4, Lee County, IL (7,589)
- Census Tract 5, Lee County, IL (4,992)
- Census Tract 3, Lee County, IL (4,155)
- Census Tract 8, Lee County, IL (3,767)
- Census Tract 9, Lee County, IL (3,557)
- Census Tract 6, Lee County, IL (3,519)
- Census Tract 2, Lee County, IL (3,483)
- Census Tract 1, Lee County, IL (2,967)
- Census Tract 7, Lee County, IL (2,002)
Top 10 Neighboring 5-Digit ZIP Code Tabulation Area (by Population) Neighboring 5-Digit ZIP Code Tabulation Area on the Map
- 61021, IL (23,745)
- 61081, IL (21,934)
- 61068, IL (14,858)
- 61071, IL (14,381)
- 61342, IL (9,216)
- 61310, IL (3,970)
- 61064, IL (3,868)
- 60518, IL (3,580)
- 61376, IL (2,280)
- 60150, IL (1,794)
Data
Demographic, Population, Households, and Housing Units
** Data sources from census 2010 **
Show Data on Map
Download Full List as CSV
Download Quick Sheet as CSV
| Subject | This Area | Illinois | National |
|---|---|---|---|
| POPULATION | |||
| Total Population Map | 36,031 | 12,830,632 | 308,745,538 |
| POPULATION, HISPANIC OR LATINO ORIGIN | |||
| Not Hispanic or Latino Map | 34,229 | 10,803,054 | 258,267,944 |
| Hispanic or Latino Map | 1,802 | 2,027,578 | 50,477,594 |
| POPULATION, RACE | |||
| White alone Map | 32,745 | 9,177,877 | 223,553,265 |
| Black or African American alone Map | 1,735 | 1,866,414 | 38,929,319 |
| American Indian and Alaska Native alone Map | 74 | 43,963 | 2,932,248 |
| Asian alone Map | 246 | 586,934 | 14,674,252 |
| Native Hawaiian and Other Pacific Islander alone Map | 10 | 4,050 | 540,013 |
| Some Other Race alone Map | 693 | 861,412 | 19,107,368 |
| Two or More Races Map | 528 | 289,982 | 9,009,073 |
| POPULATION, SEX | |||
| Male Map | 18,910 | 6,292,276 | 151,781,326 |
| Female Map | 17,121 | 6,538,356 | 156,964,212 |
| POPULATION, AGE (18 YEARS) | |||
| 18 years and over Map | 28,297 | 9,701,453 | 234,564,071 |
| Under 18 years | 7,734 | 3,129,179 | 74,181,467 |
| POPULATION, AGE | |||
| Under 5 years | 2,048 | 835,577 | 20,201,362 |
| 5 to 9 years | 2,062 | 859,405 | 20,348,657 |
| 10 to 14 years | 2,126 | 879,448 | 20,677,194 |
| 15 to 17 years | 1,498 | 554,749 | 12,954,254 |
| 18 and 19 years | 916 | 367,343 | 9,086,089 |
| 20 years | 416 | 179,613 | 4,519,129 |
| 21 years | 400 | 172,795 | 4,354,294 |
| 22 to 24 years | 1,184 | 526,556 | 12,712,576 |
| 25 to 29 years | 2,073 | 910,273 | 21,101,849 |
| 30 to 34 years | 2,159 | 865,684 | 19,962,099 |
| 35 to 39 years | 2,152 | 855,790 | 20,179,642 |
| 40 to 44 years | 2,544 | 870,100 | 20,890,964 |
| 45 to 49 years | 3,000 | 940,094 | 22,708,591 |
| 50 to 54 years | 2,985 | 930,785 | 22,298,125 |
| 55 to 59 years | 2,585 | 807,778 | 19,664,805 |
| 60 and 61 years | 891 | 284,180 | 7,113,727 |
| 62 to 64 years | 1,348 | 381,249 | 9,704,197 |
| 65 and 66 years | 670 | 205,270 | 5,319,902 |
| 67 to 69 years | 939 | 279,790 | 7,115,361 |
| 70 to 74 years | 1,323 | 364,475 | 9,278,166 |
| 75 to 79 years | 1,070 | 289,385 | 7,317,795 |
| 80 to 84 years | 819 | 235,381 | 5,743,327 |
| 85 years and over | 823 | 234,912 | 5,493,433 |
| MEDIAN AGE BY SEX | |||
| Both sexes Map | 42.00 | 36.60 | 37.20 |
| Male Map | 40.90 | 35.20 | 35.80 |
| Female Map | 43.30 | 37.90 | 38.50 |
| HOUSEHOLDS | |||
| Total Households Map | 13,758 | 4,836,972 | 116,716,292 |
| HOUSEHOLDS, HOUSEHOLD TYPE | |||
| Family households: Map | 9,064 | 3,182,984 | 77,538,296 |
| Husband-wife family Map | 7,049 | 2,332,995 | 56,510,377 |
| Other family: Map | 2,015 | 849,989 | 21,027,919 |
| Male householder, no wife present Map | 641 | 227,684 | 5,777,570 |
| Female householder, no husband present Map | 1,374 | 622,305 | 15,250,349 |
| Nonfamily households: Map | 4,694 | 1,653,988 | 39,177,996 |
| Householder living alone Map | 3,962 | 1,346,312 | 31,204,909 |
| Householder not living alone Map | 732 | 307,676 | 7,973,087 |
| HOUSEHOLDS, HISPANIC OR LATINO ORIGIN OF HOUSEHOLDER | |||
| Not Hispanic or Latino householder: Map | 13,377 | 4,329,737 | 103,254,926 |
| Hispanic or Latino householder: Map | 381 | 507,235 | 13,461,366 |
| HOUSEHOLDS, RACE OF HOUSEHOLDER | |||
| Householder who is White alone | 13,245 | 3,680,912 | 89,754,352 |
| Householder who is Black or African American alone | 176 | 668,152 | 14,129,983 |
| Householder who is American Indian and Alaska Native alone | 25 | 13,449 | 939,707 |
| Householder who is Asian alone | 65 | 192,603 | 4,632,164 |
| Householder who is Native Hawaiian and Other Pacific Islander alone | 3 | 1,278 | 143,932 |
| Householder who is Some Other Race alone | 132 | 213,509 | 4,916,427 |
| Householder who is Two or More Races | 112 | 67,069 | 2,199,727 |
| HOUSEHOLDS, HOUSEHOLD TYPE BY HOUSEHOLD SIZE | |||
| Family households: Map | 9,064 | 3,182,984 | 77,538,296 |
| 2-person household Map | 4,364 | 1,259,669 | 31,882,616 |
| 3-person household Map | 1,868 | 720,213 | 17,765,829 |
| 4-person household Map | 1,641 | 644,972 | 15,214,075 |
| 5-person household Map | 767 | 326,688 | 7,411,997 |
| 6-person household Map | 275 | 132,759 | 3,026,278 |
| 7-or-more-person household Map | 149 | 98,683 | 2,237,501 |
| Nonfamily households: Map | 4,694 | 1,653,988 | 39,177,996 |
| 1-person household Map | 3,962 | 1,346,312 | 31,204,909 |
| 2-person household Map | 600 | 250,239 | 6,360,012 |
| 3-person household Map | 82 | 36,254 | 992,156 |
| 4-person household Map | 35 | 14,759 | 411,171 |
| 5-person household Map | 12 | 3,959 | 126,634 |
| 6-person household Map | 3 | 1,433 | 48,421 |
| 7-or-more-person household Map | 0 | 1,032 | 34,693 |
| HOUSING UNITS | |||
| Total Housing Units Map | 15,049 | 5,296,715 | 131,704,730 |
| HOUSING UNITS, OCCUPANCY STATUS | |||
| Occupied Map | 13,758 | 4,836,972 | 116,716,292 |
| Vacant Map | 1,291 | 459,743 | 14,988,438 |
| HOUSING UNITS, OCCUPIED, TENURE | |||
| Owned with a mortgage or a loan Map | 6,670 | 2,338,493 | 52,979,430 |
| Owned free and clear Map | 3,543 | 925,146 | 23,006,644 |
| Renter occupied Map | 3,545 | 1,573,333 | 40,730,218 |
| HOUSING UNITS, VACANT, VACANCY STATUS | |||
| For rent Map | 288 | 158,882 | 4,137,567 |
| Rented, not occupied Map | 20 | 7,998 | 206,825 |
| For sale only Map | 256 | 82,739 | 1,896,796 |
| Sold, not occupied Map | 56 | 16,677 | 421,032 |
| For seasonal, recreational, or occasional use Map | 210 | 47,289 | 4,649,298 |
| For migrant workers Map | 1 | 315 | 24,161 |
| Other vacant Map | 460 | 145,843 | 3,652,759 |
| HOUSING UNITS, OCCUPIED, AVERAGE HOUSEHOLD SIZE BY TENURE | |||
| Total: Map | 2.41 | 2.59 | 2.58 |
| Owner occupied Map | 2.50 | 2.69 | 2.65 |
| Renter occupied Map | 2.15 | 2.38 | 2.44 |
| HOUSING UNITS, OCCUPIED, TENURE BY RACE OF HOUSEHOLDER | |||
| Owner occupied: Map | 10,213 | 3,263,639 | 75,986,074 |
| Householder who is White alone Map | 9,958 | 2,728,000 | 63,446,275 |
| Householder who is Black or African American alone Map | 66 | 272,489 | 6,261,464 |
| Householder who is American Indian and Alaska Native alone Map | 11 | 6,873 | 509,588 |
| Householder who is Asian alone Map | 38 | 118,649 | 2,688,861 |
| Householder who is Native Hawaiian and Other Pacific Islander alone Map | 1 | 644 | 61,911 |
| Householder who is Some Other Race alone Map | 76 | 103,641 | 1,975,817 |
| Householder who is Two or More Races Map | 63 | 33,343 | 1,042,158 |
| Renter occupied: Map | 3,545 | 1,573,333 | 40,730,218 |
| Householder who is White alone Map | 3,287 | 952,912 | 26,308,077 |
| Householder who is Black or African American alone Map | 110 | 395,663 | 7,868,519 |
| Householder who is American Indian and Alaska Native alone Map | 14 | 6,576 | 430,119 |
| Householder who is Asian alone Map | 27 | 73,954 | 1,943,303 |
| Householder who is Native Hawaiian and Other Pacific Islander alone Map | 2 | 634 | 82,021 |
| Householder who is Some Other Race alone Map | 56 | 109,868 | 2,940,610 |
| Householder who is Two or More Races Map | 49 | 33,726 | 1,157,569 |
| HOUSING UNITS, OCCUPIED, TENURE BY HISPANIC OR LATINO ORIGIN OF HOUSEHOLDER | |||
| Owner occupied: Map | 10,213 | 3,263,639 | 75,986,074 |
| Not Hispanic or Latino householder Map | 9,993 | 2,996,581 | 69,617,625 |
| Hispanic or Latino householder Map | 220 | 267,058 | 6,368,449 |
| Renter occupied: Map | 3,545 | 1,573,333 | 40,730,218 |
| Not Hispanic or Latino householder Map | 3,384 | 1,333,156 | 33,637,301 |
| Hispanic or Latino householder Map | 161 | 240,177 | 7,092,917 |
| HOUSING UNITS, OCCUPIED, TENURE BY HOUSEHOLD SIZE | |||
| Owner occupied: Map | 10,213 | 3,263,639 | 75,986,074 |
| 1-person household Map | 2,370 | 732,688 | 16,453,569 |
| 2-person household Map | 4,094 | 1,111,442 | 27,618,605 |
| 3-person household Map | 1,490 | 529,763 | 12,517,563 |
| 4-person household Map | 1,321 | 493,300 | 10,998,793 |
| 5-person household Map | 613 | 238,851 | 5,057,765 |
| 6-person household Map | 207 | 92,193 | 1,965,796 |
| 7-or-more-person household Map | 118 | 65,402 | 1,373,983 |
| Renter occupied: Map | 3,545 | 1,573,333 | 40,730,218 |
| 1-person household Map | 1,592 | 613,624 | 14,751,340 |
| 2-person household Map | 870 | 398,466 | 10,624,023 |
| 3-person household Map | 460 | 226,704 | 6,240,422 |
| 4-person household Map | 355 | 166,431 | 4,626,453 |
| 5-person household Map | 166 | 91,796 | 2,480,866 |
| 6-person household Map | 71 | 41,999 | 1,108,903 |
| 7-or-more-person household Map | 31 | 34,313 | 898,211 |
Loading...