


DeKalb County, Illinois
About
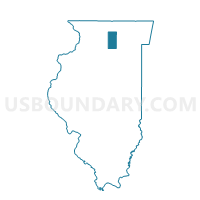
Outline

Summary
| Unique Area Identifier | 120195 |
| Name | DeKalb County |
| State | Illinois |
| Area (square miles) | 634.66 |
| Land Area (square miles) | 631.31 |
| Water Area (square miles) | 3.35 |
| % of Land Area | 99.47 |
| % of Water Area | 0.53 |
| Latitude of the Internal Point | 41.89461250 |
| Longtitude of the Internal Point | -88.76899100 |
| Total Population | 105,160 |
| Total Housing Units | 41,079 |
| Total Households | 38,484 |
| Median Age | 29.3 |
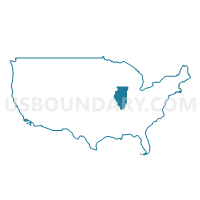
Maps
Graphs
Select a template below for downloading or customizing gragh for DeKalb County, Illinois


Neighbors
Neighoring County (by Name) Neighboring County on the Map
- Boone County, IL
- Kane County, IL
- Kendall County, IL
- LaSalle County, IL
- Lee County, IL
- McHenry County, IL
- Ogle County, IL
- Winnebago County, IL
County Subdivision in DeKalb County (by Name) Neighboring County Subdivision on the Map
- Afton township, DeKalb County, IL
- Clinton township, DeKalb County, IL
- Cortland township, DeKalb County, IL
- DeKalb township, DeKalb County, IL
- Franklin township, DeKalb County, IL
- Genoa township, DeKalb County, IL
- Kingston township, DeKalb County, IL
- Malta township, DeKalb County, IL
- Mayfield township, DeKalb County, IL
- Milan township, DeKalb County, IL
- Paw Paw township, DeKalb County, IL
- Pierce township, DeKalb County, IL
- Sandwich township, DeKalb County, IL
- Shabbona township, DeKalb County, IL
- Somonauk township, DeKalb County, IL
- South Grove township, DeKalb County, IL
- Squaw Grove township, DeKalb County, IL
- Sycamore township, DeKalb County, IL
- Victor township, DeKalb County, IL
Top 10 Neighboring Place (by Population) Neighboring Place on the Map
- DeKalb city, IL (43,862)
- Sycamore city, IL (17,519)
- Sandwich city, IL (7,421)
- Genoa city, IL (5,193)
- Lake Holiday CDP, IL (4,761)
- Cortland town, IL (4,270)
- Hinckley village, IL (2,070)
- Somonauk village, IL (1,893)
- Kirkland village, IL (1,744)
- Waterman village, IL (1,506)
Top 10 Neighboring Elementary School District (by Population) Neighboring Elementary School District on the Map
- Riley Community Consolidated School District 18, IL (3,398)
- Creston Community Consolidated School District 161, IL (959)
- Eswood Community Consolidated District 269, IL (890)
- Steward Elementary School District 220, IL (626)
Top 10 Neighboring Secondary School District (by Population) Neighboring Secondary School District on the Map
- Rochelle Township High School District 212, IL (17,129)
- Marengo Community High School District 154, IL (13,933)
Top 10 Neighboring Unified School District (by Population) Neighboring Unified School District on the Map
- Community Unit School District 300, IL (110,689)
- DeKalb Community Unit School District 428, IL (52,734)
- Belvidere Consolidated Unit School District 100, IL (45,236)
- Kaneland Community Unit School District 302, IL (25,685)
- Sycamore Community Unit School District 427, IL (21,667)
- Central Community Unit School District 301, IL (17,995)
- Sandwich Community Unit School District 430, IL (13,473)
- Plano Community Unit School District 88, IL (11,288)
- Genoa-Kingston Community Unit School District 424, IL (9,221)
- Meridian Community Unit School District 223, IL (9,100)
Top 10 Neighboring State Legislative District Lower Chamber (by Population) Neighboring State Legislative District Lower Chamber on the Map
- State House District 50, IL (178,899)
- State House District 49, IL (154,080)
- State House District 69, IL (123,633)
- State House District 63, IL (122,290)
- State House District 70, IL (121,976)
- State House District 76, IL (105,699)
- State House District 90, IL (103,604)
Top 10 Neighboring State Legislative District Upper Chamber (by Population) Neighboring State Legislative District Upper Chamber on the Map
- State Senate District 25, IL (332,979)
- State Senate District 32, IL (254,707)
- State Senate District 35, IL (245,609)
- State Senate District 38, IL (231,284)
- State Senate District 45, IL (209,870)
Top 10 Neighboring 111th Congressional District (by Population) Neighboring 111th Congressional District on the Map
- Congressional District 14, IL (840,956)
- Congressional District 11, IL (759,445)
- Congressional District 16, IL (718,791)
Top 10 Census Tract in DeKalb County (by Population) Neighboring Census Tract on the Map
- Census Tract 4, DeKalb County, IL (8,622)
- Census Tract 10.01, DeKalb County, IL (7,025)
- Census Tract 8, DeKalb County, IL (6,836)
- Census Tract 1, DeKalb County, IL (6,712)
- Census Tract 14, DeKalb County, IL (6,451)
- Census Tract 6, DeKalb County, IL (6,030)
- Census Tract 22, DeKalb County, IL (6,016)
- Census Tract 10.02, DeKalb County, IL (5,782)
- Census Tract 13, DeKalb County, IL (5,517)
- Census Tract 9, DeKalb County, IL (5,113)
Top 10 Neighboring 5-Digit ZIP Code Tabulation Area (by Population) Neighboring 5-Digit ZIP Code Tabulation Area on the Map
- 60115, IL (46,272)
- 60178, IL (21,840)
- 61068, IL (14,858)
- 60140, IL (14,341)
- 60545, IL (12,940)
- 60152, IL (12,533)
- 60548, IL (12,218)
- 60119, IL (10,371)
- 60135, IL (7,248)
- 60112, IL (4,560)
Data
Demographic, Population, Households, and Housing Units
** Data sources from census 2010 **
Show Data on Map
Download Full List as CSV
Download Quick Sheet as CSV
| Subject | This Area | Illinois | National |
|---|---|---|---|
| POPULATION | |||
| Total Population Map | 105,160 | 12,830,632 | 308,745,538 |
| POPULATION, HISPANIC OR LATINO ORIGIN | |||
| Not Hispanic or Latino Map | 94,513 | 10,803,054 | 258,267,944 |
| Hispanic or Latino Map | 10,647 | 2,027,578 | 50,477,594 |
| POPULATION, RACE | |||
| White alone Map | 89,453 | 9,177,877 | 223,553,265 |
| Black or African American alone Map | 6,732 | 1,866,414 | 38,929,319 |
| American Indian and Alaska Native alone Map | 267 | 43,963 | 2,932,248 |
| Asian alone Map | 2,438 | 586,934 | 14,674,252 |
| Native Hawaiian and Other Pacific Islander alone Map | 23 | 4,050 | 540,013 |
| Some Other Race alone Map | 4,149 | 861,412 | 19,107,368 |
| Two or More Races Map | 2,098 | 289,982 | 9,009,073 |
| POPULATION, SEX | |||
| Male Map | 52,530 | 6,292,276 | 151,781,326 |
| Female Map | 52,630 | 6,538,356 | 156,964,212 |
| POPULATION, AGE (18 YEARS) | |||
| 18 years and over Map | 81,670 | 9,701,453 | 234,564,071 |
| Under 18 years | 23,490 | 3,129,179 | 74,181,467 |
| POPULATION, AGE | |||
| Under 5 years | 6,645 | 835,577 | 20,201,362 |
| 5 to 9 years | 6,655 | 859,405 | 20,348,657 |
| 10 to 14 years | 6,351 | 879,448 | 20,677,194 |
| 15 to 17 years | 3,839 | 554,749 | 12,954,254 |
| 18 and 19 years | 5,916 | 367,343 | 9,086,089 |
| 20 years | 3,529 | 179,613 | 4,519,129 |
| 21 years | 3,789 | 172,795 | 4,354,294 |
| 22 to 24 years | 8,583 | 526,556 | 12,712,576 |
| 25 to 29 years | 8,271 | 910,273 | 21,101,849 |
| 30 to 34 years | 6,496 | 865,684 | 19,962,099 |
| 35 to 39 years | 5,945 | 855,790 | 20,179,642 |
| 40 to 44 years | 6,011 | 870,100 | 20,890,964 |
| 45 to 49 years | 6,702 | 940,094 | 22,708,591 |
| 50 to 54 years | 6,349 | 930,785 | 22,298,125 |
| 55 to 59 years | 5,429 | 807,778 | 19,664,805 |
| 60 and 61 years | 1,848 | 284,180 | 7,113,727 |
| 62 to 64 years | 2,465 | 381,249 | 9,704,197 |
| 65 and 66 years | 1,336 | 205,270 | 5,319,902 |
| 67 to 69 years | 1,784 | 279,790 | 7,115,361 |
| 70 to 74 years | 2,275 | 364,475 | 9,278,166 |
| 75 to 79 years | 1,870 | 289,385 | 7,317,795 |
| 80 to 84 years | 1,496 | 235,381 | 5,743,327 |
| 85 years and over | 1,576 | 234,912 | 5,493,433 |
| MEDIAN AGE BY SEX | |||
| Both sexes Map | 29.30 | 36.60 | 37.20 |
| Male Map | 28.50 | 35.20 | 35.80 |
| Female Map | 30.30 | 37.90 | 38.50 |
| HOUSEHOLDS | |||
| Total Households Map | 38,484 | 4,836,972 | 116,716,292 |
| HOUSEHOLDS, HOUSEHOLD TYPE | |||
| Family households: Map | 23,781 | 3,182,984 | 77,538,296 |
| Husband-wife family Map | 18,164 | 2,332,995 | 56,510,377 |
| Other family: Map | 5,617 | 849,989 | 21,027,919 |
| Male householder, no wife present Map | 1,699 | 227,684 | 5,777,570 |
| Female householder, no husband present Map | 3,918 | 622,305 | 15,250,349 |
| Nonfamily households: Map | 14,703 | 1,653,988 | 39,177,996 |
| Householder living alone Map | 9,934 | 1,346,312 | 31,204,909 |
| Householder not living alone Map | 4,769 | 307,676 | 7,973,087 |
| HOUSEHOLDS, HISPANIC OR LATINO ORIGIN OF HOUSEHOLDER | |||
| Not Hispanic or Latino householder: Map | 36,013 | 4,329,737 | 103,254,926 |
| Hispanic or Latino householder: Map | 2,471 | 507,235 | 13,461,366 |
| HOUSEHOLDS, RACE OF HOUSEHOLDER | |||
| Householder who is White alone | 33,979 | 3,680,912 | 89,754,352 |
| Householder who is Black or African American alone | 2,183 | 668,152 | 14,129,983 |
| Householder who is American Indian and Alaska Native alone | 78 | 13,449 | 939,707 |
| Householder who is Asian alone | 760 | 192,603 | 4,632,164 |
| Householder who is Native Hawaiian and Other Pacific Islander alone | 6 | 1,278 | 143,932 |
| Householder who is Some Other Race alone | 1,024 | 213,509 | 4,916,427 |
| Householder who is Two or More Races | 454 | 67,069 | 2,199,727 |
| HOUSEHOLDS, HOUSEHOLD TYPE BY HOUSEHOLD SIZE | |||
| Family households: Map | 23,781 | 3,182,984 | 77,538,296 |
| 2-person household Map | 9,764 | 1,259,669 | 31,882,616 |
| 3-person household Map | 5,258 | 720,213 | 17,765,829 |
| 4-person household Map | 4,952 | 644,972 | 15,214,075 |
| 5-person household Map | 2,447 | 326,688 | 7,411,997 |
| 6-person household Map | 868 | 132,759 | 3,026,278 |
| 7-or-more-person household Map | 492 | 98,683 | 2,237,501 |
| Nonfamily households: Map | 14,703 | 1,653,988 | 39,177,996 |
| 1-person household Map | 9,934 | 1,346,312 | 31,204,909 |
| 2-person household Map | 3,150 | 250,239 | 6,360,012 |
| 3-person household Map | 887 | 36,254 | 992,156 |
| 4-person household Map | 528 | 14,759 | 411,171 |
| 5-person household Map | 141 | 3,959 | 126,634 |
| 6-person household Map | 43 | 1,433 | 48,421 |
| 7-or-more-person household Map | 20 | 1,032 | 34,693 |
| HOUSING UNITS | |||
| Total Housing Units Map | 41,079 | 5,296,715 | 131,704,730 |
| HOUSING UNITS, OCCUPANCY STATUS | |||
| Occupied Map | 38,484 | 4,836,972 | 116,716,292 |
| Vacant Map | 2,595 | 459,743 | 14,988,438 |
| HOUSING UNITS, OCCUPIED, TENURE | |||
| Owned with a mortgage or a loan Map | 17,851 | 2,338,493 | 52,979,430 |
| Owned free and clear Map | 5,696 | 925,146 | 23,006,644 |
| Renter occupied Map | 14,937 | 1,573,333 | 40,730,218 |
| HOUSING UNITS, VACANT, VACANCY STATUS | |||
| For rent Map | 1,137 | 158,882 | 4,137,567 |
| Rented, not occupied Map | 46 | 7,998 | 206,825 |
| For sale only Map | 559 | 82,739 | 1,896,796 |
| Sold, not occupied Map | 79 | 16,677 | 421,032 |
| For seasonal, recreational, or occasional use Map | 148 | 47,289 | 4,649,298 |
| For migrant workers Map | 2 | 315 | 24,161 |
| Other vacant Map | 624 | 145,843 | 3,652,759 |
| HOUSING UNITS, OCCUPIED, AVERAGE HOUSEHOLD SIZE BY TENURE | |||
| Total: Map | 2.56 | 2.59 | 2.58 |
| Owner occupied Map | 2.73 | 2.69 | 2.65 |
| Renter occupied Map | 2.29 | 2.38 | 2.44 |
| HOUSING UNITS, OCCUPIED, TENURE BY RACE OF HOUSEHOLDER | |||
| Owner occupied: Map | 23,547 | 3,263,639 | 75,986,074 |
| Householder who is White alone Map | 22,389 | 2,728,000 | 63,446,275 |
| Householder who is Black or African American alone Map | 280 | 272,489 | 6,261,464 |
| Householder who is American Indian and Alaska Native alone Map | 43 | 6,873 | 509,588 |
| Householder who is Asian alone Map | 245 | 118,649 | 2,688,861 |
| Householder who is Native Hawaiian and Other Pacific Islander alone Map | 3 | 644 | 61,911 |
| Householder who is Some Other Race alone Map | 405 | 103,641 | 1,975,817 |
| Householder who is Two or More Races Map | 182 | 33,343 | 1,042,158 |
| Renter occupied: Map | 14,937 | 1,573,333 | 40,730,218 |
| Householder who is White alone Map | 11,590 | 952,912 | 26,308,077 |
| Householder who is Black or African American alone Map | 1,903 | 395,663 | 7,868,519 |
| Householder who is American Indian and Alaska Native alone Map | 35 | 6,576 | 430,119 |
| Householder who is Asian alone Map | 515 | 73,954 | 1,943,303 |
| Householder who is Native Hawaiian and Other Pacific Islander alone Map | 3 | 634 | 82,021 |
| Householder who is Some Other Race alone Map | 619 | 109,868 | 2,940,610 |
| Householder who is Two or More Races Map | 272 | 33,726 | 1,157,569 |
| HOUSING UNITS, OCCUPIED, TENURE BY HISPANIC OR LATINO ORIGIN OF HOUSEHOLDER | |||
| Owner occupied: Map | 23,547 | 3,263,639 | 75,986,074 |
| Not Hispanic or Latino householder Map | 22,426 | 2,996,581 | 69,617,625 |
| Hispanic or Latino householder Map | 1,121 | 267,058 | 6,368,449 |
| Renter occupied: Map | 14,937 | 1,573,333 | 40,730,218 |
| Not Hispanic or Latino householder Map | 13,587 | 1,333,156 | 33,637,301 |
| Hispanic or Latino householder Map | 1,350 | 240,177 | 7,092,917 |
| HOUSING UNITS, OCCUPIED, TENURE BY HOUSEHOLD SIZE | |||
| Owner occupied: Map | 23,547 | 3,263,639 | 75,986,074 |
| 1-person household Map | 4,551 | 732,688 | 16,453,569 |
| 2-person household Map | 8,479 | 1,111,442 | 27,618,605 |
| 3-person household Map | 3,817 | 529,763 | 12,517,563 |
| 4-person household Map | 3,853 | 493,300 | 10,998,793 |
| 5-person household Map | 1,824 | 238,851 | 5,057,765 |
| 6-person household Map | 658 | 92,193 | 1,965,796 |
| 7-or-more-person household Map | 365 | 65,402 | 1,373,983 |
| Renter occupied: Map | 14,937 | 1,573,333 | 40,730,218 |
| 1-person household Map | 5,383 | 613,624 | 14,751,340 |
| 2-person household Map | 4,435 | 398,466 | 10,624,023 |
| 3-person household Map | 2,328 | 226,704 | 6,240,422 |
| 4-person household Map | 1,627 | 166,431 | 4,626,453 |
| 5-person household Map | 764 | 91,796 | 2,480,866 |
| 6-person household Map | 253 | 41,999 | 1,108,903 |
| 7-or-more-person household Map | 147 | 34,313 | 898,211 |
Loading...