


State Senate District 2, West Virginia
About
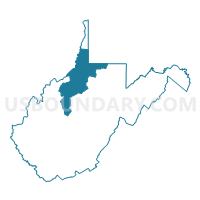
Outline

Summary
| Unique Area Identifier | 201650 |
| Name | State Senate District 2 |
| State | West Virginia |
| Area (square miles) | 2,233.39 |
| Land Area (square miles) | 2,213.72 |
| Water Area (square miles) | 19.67 |
| % of Land Area | 99.12 |
| % of Water Area | 0.88 |
| Latitude of the Internal Point | 39.40401300 |
| Longtitude of the Internal Point | -80.81235050 |
| Total Population | 101,327 |
| Total Housing Units | 50,324 |
| Total Households | 41,960 |
| Median Age | 44.1 |
Maps
Graphs
Select a template below for downloading or customizing gragh for State Senate District 2, West Virginia


Neighbors
Neighoring State Legislative District Upper Chamber (by Name) Neighboring State Legislative District Upper Chamber on the Map
- State Senate District 1, WV
- State Senate District 11, WV
- State Senate District 12, WV
- State Senate District 13, WV
- State Senate District 20, OH
- State Senate District 3, WV
- State Senate District 30, OH
- State Senate District 46, PA
Top 10 Neighboring County (by Population) Neighboring County on the Map
- Washington County, PA (207,820)
- Monongalia County, WV (96,189)
- Wood County, WV (86,956)
- Belmont County, OH (70,400)
- Harrison County, WV (69,099)
- Washington County, OH (61,778)
- Marion County, WV (56,418)
- Ohio County, WV (44,443)
- Greene County, PA (38,686)
- Marshall County, WV (33,107)
Top 10 Neighboring County Subdivision (by Population) Neighboring County Subdivision on the Map
- Western district, Monongalia County, WV (27,045)
- West Augusta district, Marion County, WV (17,224)
- District 1, Ohio County, WV (16,752)
- District 3, Ohio County, WV (15,243)
- Pease township, Belmont County, OH (14,309)
- District 2, Ohio County, WV (12,448)
- District 3, Marshall County, WV (12,042)
- District 1, Marshall County, WV (10,892)
- Northern district, Harrison County, WV (10,741)
- Southwest district, Harrison County, WV (10,423)
Top 10 Neighboring Place (by Population) Neighboring Place on the Map
- Wheeling city, WV (28,486)
- Moundsville city, WV (9,318)
- Martins Ferry city, OH (6,915)
- New Martinsville city, WV (5,366)
- Bellaire village, OH (4,278)
- Shadyside village, OH (3,785)
- Paden City city, WV (2,633)
- Bethlehem village, WV (2,499)
- Mannington city, WV (2,063)
- McMechen city, WV (1,926)
Top 10 Neighboring Unified School District (by Population) Neighboring Unified School District on the Map
- Monongalia School District, WV (96,189)
- Wood County School District, WV (86,956)
- Harrison County School District, WV (69,099)
- Marion County School District, WV (56,418)
- Ohio County School District, WV (44,443)
- Marshall County School District, WV (33,107)
- Switzerland of Ohio Local School District, OH (17,913)
- Wetzel County School District, WV (16,583)
- Lewis County School District, WV (16,372)
- Central Greene School District, PA (15,921)
Top 10 Neighboring State Legislative District Lower Chamber (by Population) Neighboring State Legislative District Lower Chamber on the Map
- State House District 93, OH (116,725)
- State House District 95, OH (106,820)
- State House District 44, WV (89,802)
- State House District 41, WV (71,101)
- State House District 50, PA (59,028)
- State House District 49, PA (58,268)
- State House District 43, WV (56,711)
- State House District 2, WV (34,538)
- State House District 4, WV (33,317)
- State House District 3, WV (31,628)
Top 10 Neighboring 111th Congressional District (by Population) Neighboring 111th Congressional District on the Map
- Congressional District 18, PA (653,385)
- Congressional District 2, WV (648,186)
- Congressional District 6, OH (623,742)
- Congressional District 1, WV (615,991)
- Congressional District 12, PA (612,384)
Top 10 Neighboring Census Tract (by Population) Neighboring Census Tract on the Map
- Census Tract 210, Marshall County, WV (6,537)
- Census Tract 9677, Gilmer County, WV (6,390)
- Census Tract 107.01, Wood County, WV (6,082)
- Census Tract 212, Washington County, OH (5,777)
- Census Tract 209, Marshall County, WV (5,299)
- Census Tract 18, Ohio County, WV (5,261)
- Census Tract 211, Marshall County, WV (5,096)
- Census Tract 110, Belmont County, OH (5,009)
- Census Tract 208, Marshall County, WV (4,741)
- Census Tract 115, Monongalia County, WV (4,708)
Top 10 Neighboring 5-Digit ZIP Code Tabulation Area (by Population) Neighboring 5-Digit ZIP Code Tabulation Area on the Map
- 26003, WV (43,002)
- 26501, WV (19,616)
- 26041, WV (16,183)
- 26452, WV (9,676)
- 43935, OH (8,943)
- 26155, WV (8,823)
- 43906, OH (8,678)
- 25276, WV (7,752)
- 26426, WV (7,003)
- 43912, OH (6,801)
Data
Demographic, Population, Households, and Housing Units
** Data sources from census 2010 **
Show Data on Map
Download Full List as CSV
Download Quick Sheet as CSV
| Subject | This Area | West Virginia | National |
|---|---|---|---|
| POPULATION | |||
| Total Population Map | 101,327 | 1,852,994 | 308,745,538 |
| POPULATION, HISPANIC OR LATINO ORIGIN | |||
| Not Hispanic or Latino Map | 100,690 | 1,830,726 | 258,267,944 |
| Hispanic or Latino Map | 637 | 22,268 | 50,477,594 |
| POPULATION, RACE | |||
| White alone Map | 99,120 | 1,739,988 | 223,553,265 |
| Black or African American alone Map | 705 | 63,124 | 38,929,319 |
| American Indian and Alaska Native alone Map | 173 | 3,787 | 2,932,248 |
| Asian alone Map | 262 | 12,406 | 14,674,252 |
| Native Hawaiian and Other Pacific Islander alone Map | 10 | 428 | 540,013 |
| Some Other Race alone Map | 131 | 6,119 | 19,107,368 |
| Two or More Races Map | 926 | 27,142 | 9,009,073 |
| POPULATION, SEX | |||
| Male Map | 50,139 | 913,586 | 151,781,326 |
| Female Map | 51,188 | 939,408 | 156,964,212 |
| POPULATION, AGE (18 YEARS) | |||
| 18 years and over Map | 80,110 | 1,465,576 | 234,564,071 |
| Under 18 years | 21,217 | 387,418 | 74,181,467 |
| POPULATION, AGE | |||
| Under 5 years | 5,312 | 104,060 | 20,201,362 |
| 5 to 9 years | 5,722 | 106,016 | 20,348,657 |
| 10 to 14 years | 6,065 | 109,045 | 20,677,194 |
| 15 to 17 years | 4,118 | 68,297 | 12,954,254 |
| 18 and 19 years | 2,467 | 51,795 | 9,086,089 |
| 20 years | 1,056 | 25,873 | 4,519,129 |
| 21 years | 1,052 | 24,305 | 4,354,294 |
| 22 to 24 years | 2,818 | 67,026 | 12,712,576 |
| 25 to 29 years | 5,051 | 108,444 | 21,101,849 |
| 30 to 34 years | 5,534 | 112,254 | 19,962,099 |
| 35 to 39 years | 6,035 | 117,136 | 20,179,642 |
| 40 to 44 years | 6,827 | 120,358 | 20,890,964 |
| 45 to 49 years | 7,516 | 132,924 | 22,708,591 |
| 50 to 54 years | 8,257 | 143,232 | 22,298,125 |
| 55 to 59 years | 8,047 | 139,368 | 19,664,805 |
| 60 and 61 years | 3,088 | 53,956 | 7,113,727 |
| 62 to 64 years | 4,475 | 71,501 | 9,704,197 |
| 65 and 66 years | 2,306 | 38,447 | 5,319,902 |
| 67 to 69 years | 3,184 | 53,281 | 7,115,361 |
| 70 to 74 years | 4,483 | 71,792 | 9,278,166 |
| 75 to 79 years | 3,287 | 54,725 | 7,317,795 |
| 80 to 84 years | 2,573 | 43,238 | 5,743,327 |
| 85 years and over | 2,054 | 35,921 | 5,493,433 |
| MEDIAN AGE BY SEX | |||
| Both sexes Map | 44.10 | 41.30 | 37.20 |
| Male Map | 42.90 | 40.10 | 35.80 |
| Female Map | 45.10 | 42.60 | 38.50 |
| HOUSEHOLDS | |||
| Total Households Map | 41,960 | 763,831 | 116,716,292 |
| HOUSEHOLDS, HOUSEHOLD TYPE | |||
| Family households: Map | 28,584 | 502,332 | 77,538,296 |
| Husband-wife family Map | 22,130 | 380,426 | 56,510,377 |
| Other family: Map | 6,454 | 121,906 | 21,027,919 |
| Male householder, no wife present Map | 2,018 | 36,374 | 5,777,570 |
| Female householder, no husband present Map | 4,436 | 85,532 | 15,250,349 |
| Nonfamily households: Map | 13,376 | 261,499 | 39,177,996 |
| Householder living alone Map | 11,478 | 217,308 | 31,204,909 |
| Householder not living alone Map | 1,898 | 44,191 | 7,973,087 |
| HOUSEHOLDS, HISPANIC OR LATINO ORIGIN OF HOUSEHOLDER | |||
| Not Hispanic or Latino householder: Map | 41,735 | 757,775 | 103,254,926 |
| Hispanic or Latino householder: Map | 225 | 6,056 | 13,461,366 |
| HOUSEHOLDS, RACE OF HOUSEHOLDER | |||
| Householder who is White alone | 41,301 | 725,684 | 89,754,352 |
| Householder who is Black or African American alone | 197 | 23,832 | 14,129,983 |
| Householder who is American Indian and Alaska Native alone | 74 | 1,655 | 939,707 |
| Householder who is Asian alone | 83 | 4,304 | 4,632,164 |
| Householder who is Native Hawaiian and Other Pacific Islander alone | 3 | 121 | 143,932 |
| Householder who is Some Other Race alone | 37 | 1,415 | 4,916,427 |
| Householder who is Two or More Races | 265 | 6,820 | 2,199,727 |
| HOUSEHOLDS, HOUSEHOLD TYPE BY HOUSEHOLD SIZE | |||
| Family households: Map | 28,584 | 502,332 | 77,538,296 |
| 2-person household Map | 14,118 | 241,530 | 31,882,616 |
| 3-person household Map | 6,536 | 120,007 | 17,765,829 |
| 4-person household Map | 4,895 | 87,596 | 15,214,075 |
| 5-person household Map | 2,016 | 35,494 | 7,411,997 |
| 6-person household Map | 679 | 11,701 | 3,026,278 |
| 7-or-more-person household Map | 340 | 6,004 | 2,237,501 |
| Nonfamily households: Map | 13,376 | 261,499 | 39,177,996 |
| 1-person household Map | 11,478 | 217,308 | 31,204,909 |
| 2-person household Map | 1,643 | 36,807 | 6,360,012 |
| 3-person household Map | 147 | 4,872 | 992,156 |
| 4-person household Map | 77 | 1,841 | 411,171 |
| 5-person household Map | 23 | 488 | 126,634 |
| 6-person household Map | 4 | 111 | 48,421 |
| 7-or-more-person household Map | 4 | 72 | 34,693 |
| HOUSING UNITS | |||
| Total Housing Units Map | 50,324 | 881,917 | 131,704,730 |
| HOUSING UNITS, OCCUPANCY STATUS | |||
| Occupied Map | 41,960 | 763,831 | 116,716,292 |
| Vacant Map | 8,364 | 118,086 | 14,988,438 |
| HOUSING UNITS, OCCUPIED, TENURE | |||
| Owned with a mortgage or a loan Map | 14,954 | 293,522 | 52,979,430 |
| Owned free and clear Map | 17,824 | 267,491 | 23,006,644 |
| Renter occupied Map | 9,182 | 202,818 | 40,730,218 |
| HOUSING UNITS, VACANT, VACANCY STATUS | |||
| For rent Map | 1,012 | 19,521 | 4,137,567 |
| Rented, not occupied Map | 94 | 1,366 | 206,825 |
| For sale only Map | 499 | 10,381 | 1,896,796 |
| Sold, not occupied Map | 308 | 4,597 | 421,032 |
| For seasonal, recreational, or occasional use Map | 3,360 | 38,283 | 4,649,298 |
| For migrant workers Map | 6 | 118 | 24,161 |
| Other vacant Map | 3,085 | 43,820 | 3,652,759 |
| HOUSING UNITS, OCCUPIED, AVERAGE HOUSEHOLD SIZE BY TENURE | |||
| Total: Map | 2.38 | 2.36 | 2.58 |
| Owner occupied Map | 2.41 | 2.43 | 2.65 |
| Renter occupied Map | 2.26 | 2.18 | 2.44 |
| HOUSING UNITS, OCCUPIED, TENURE BY RACE OF HOUSEHOLDER | |||
| Owner occupied: Map | 32,778 | 561,013 | 75,986,074 |
| Householder who is White alone Map | 32,426 | 542,432 | 63,446,275 |
| Householder who is Black or African American alone Map | 81 | 11,020 | 6,261,464 |
| Householder who is American Indian and Alaska Native alone Map | 41 | 953 | 509,588 |
| Householder who is Asian alone Map | 57 | 2,278 | 2,688,861 |
| Householder who is Native Hawaiian and Other Pacific Islander alone Map | 2 | 59 | 61,911 |
| Householder who is Some Other Race alone Map | 17 | 610 | 1,975,817 |
| Householder who is Two or More Races Map | 154 | 3,661 | 1,042,158 |
| Renter occupied: Map | 9,182 | 202,818 | 40,730,218 |
| Householder who is White alone Map | 8,875 | 183,252 | 26,308,077 |
| Householder who is Black or African American alone Map | 116 | 12,812 | 7,868,519 |
| Householder who is American Indian and Alaska Native alone Map | 33 | 702 | 430,119 |
| Householder who is Asian alone Map | 26 | 2,026 | 1,943,303 |
| Householder who is Native Hawaiian and Other Pacific Islander alone Map | 1 | 62 | 82,021 |
| Householder who is Some Other Race alone Map | 20 | 805 | 2,940,610 |
| Householder who is Two or More Races Map | 111 | 3,159 | 1,157,569 |
| HOUSING UNITS, OCCUPIED, TENURE BY HISPANIC OR LATINO ORIGIN OF HOUSEHOLDER | |||
| Owner occupied: Map | 32,778 | 561,013 | 75,986,074 |
| Not Hispanic or Latino householder Map | 32,638 | 557,790 | 69,617,625 |
| Hispanic or Latino householder Map | 140 | 3,223 | 6,368,449 |
| Renter occupied: Map | 9,182 | 202,818 | 40,730,218 |
| Not Hispanic or Latino householder Map | 9,097 | 199,985 | 33,637,301 |
| Hispanic or Latino householder Map | 85 | 2,833 | 7,092,917 |
| HOUSING UNITS, OCCUPIED, TENURE BY HOUSEHOLD SIZE | |||
| Owner occupied: Map | 32,778 | 561,013 | 75,986,074 |
| 1-person household Map | 7,895 | 134,762 | 16,453,569 |
| 2-person household Map | 13,338 | 222,574 | 27,618,605 |
| 3-person household Map | 5,283 | 94,220 | 12,517,563 |
| 4-person household Map | 3,908 | 69,097 | 10,998,793 |
| 5-person household Map | 1,565 | 27,123 | 5,057,765 |
| 6-person household Map | 524 | 8,750 | 1,965,796 |
| 7-or-more-person household Map | 265 | 4,487 | 1,373,983 |
| Renter occupied: Map | 9,182 | 202,818 | 40,730,218 |
| 1-person household Map | 3,583 | 82,546 | 14,751,340 |
| 2-person household Map | 2,423 | 55,763 | 10,624,023 |
| 3-person household Map | 1,400 | 30,659 | 6,240,422 |
| 4-person household Map | 1,064 | 20,340 | 4,626,453 |
| 5-person household Map | 474 | 8,859 | 2,480,866 |
| 6-person household Map | 159 | 3,062 | 1,108,903 |
| 7-or-more-person household Map | 79 | 1,589 | 898,211 |
Loading...