


Ashland County, Wisconsin
About
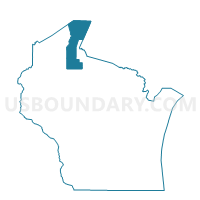
Outline

Summary
| Unique Area Identifier | 119722 |
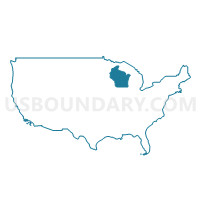
| Name | Ashland County |
| State | Wisconsin |
| Area (square miles) | 2,292.38 |
| Land Area (square miles) | 1,045.04 |
| Water Area (square miles) | 1,247.34 |
| % of Land Area | 45.59 |
| % of Water Area | 54.41 |
| Latitude of the Internal Point | 46.54629050 |
| Longtitude of the Internal Point | -90.66515390 |
| Total Population | 16,157 |
| Total Housing Units | 9,656 |
| Total Households | 6,736 |
| Median Age | 40.3 |
Maps
Graphs
Select a template below for downloading or customizing gragh for Ashland County, Wisconsin


Neighbors
Neighoring County (by Name) Neighboring County on the Map
- Bayfield County, WI
- Cook County, MN
- Gogebic County, MI
- Iron County, WI
- Lake County, MN
- Ontonagon County, MI
- Price County, WI
- Sawyer County, WI
County Subdivision in Ashland County (by Name) Neighboring County Subdivision on the Map
- Agenda town, Ashland County, WI
- Ashland city, Ashland County, WI
- Ashland town, Ashland County, WI
- Butternut village, Ashland County, WI
- Chippewa town, Ashland County, WI
- County subdivisions not defined, Ashland County, WI
- Gingles town, Ashland County, WI
- Gordon town, Ashland County, WI
- Jacobs town, Ashland County, WI
- La Pointe town, Ashland County, WI
- Marengo town, Ashland County, WI
- Mellen city, Ashland County, WI
- Morse town, Ashland County, WI
- Peeksville town, Ashland County, WI
- Sanborn town, Ashland County, WI
- Shanagolden town, Ashland County, WI
- White River town, Ashland County, WI
Top 10 Neighboring Place (by Population) Neighboring Place on the Map
- Ashland city, WI (8,216)
- Mellen city, WI (731)
- Glidden CDP, WI (507)
- New Odanah CDP, WI (472)
- Butternut village, WI (375)
- Birch Hill CDP, WI (293)
- Franks Field CDP, WI (154)
- Marengo CDP, WI (111)
- Diaperville CDP, WI (70)
- Clam Lake CDP, WI (37)
Top 10 Neighboring Unified School District (by Population) Neighboring Unified School District on the Map
- Lake Superior Public School District, MN (13,355)
- Hayward Community School District, WI (13,227)
- Ashland School District, WI (12,503)
- Ironwood Area Schools, MI (8,046)
- Chequamegon School District, WI (6,640)
- Cook County Public Schools, MN (5,176)
- Drummond Area School District, WI (4,580)
- Hurley School District, WI (4,219)
- Washburn School District, WI (3,857)
- Ontonagon Area Schools, MI (3,632)
Top 10 Neighboring State Legislative District Lower Chamber (by Population) Neighboring State Legislative District Lower Chamber on the Map
- State House District 110, MI (83,484)
- Assembly District 87, WI (52,707)
- Assembly District 74, WI (52,623)
- State House District 6A, MN (36,396)
Top 10 Neighboring State Legislative District Upper Chamber (by Population) Neighboring State Legislative District Upper Chamber on the Map
- State Senate District 38, MI (261,728)
- State Senate District 29, WI (167,310)
- State Senate District 25, WI (162,546)
- State Senate District 6, MN (76,702)
Top 10 Neighboring 111th Congressional District (by Population) Neighboring 111th Congressional District on the Map
Top 10 Census Tract in Ashland County (by Population) Neighboring Census Tract on the Map
- Census Tract 9508, Ashland County, WI (3,386)
- Census Tract 9503, Ashland County, WI (2,696)
- Census Tract 9504, Ashland County, WI (2,410)
- Census Tract 9507, Ashland County, WI (2,206)
- Census Tract 9505, Ashland County, WI (2,201)
- Census Tract 9400, Ashland County, WI (1,867)
- Census Tract 9506, Ashland County, WI (1,391)
- Census Tract 9900, Ashland County, WI (0)
Top 10 Neighboring 5-Digit ZIP Code Tabulation Area (by Population) Neighboring 5-Digit ZIP Code Tabulation Area on the Map
- 54806, WI (11,810)
- 54843, WI (11,487)
- 54552, WI (4,416)
- 54534, WI (2,459)
- 54514, WI (1,717)
- 54856, WI (1,616)
- 54896, WI (1,478)
- 54547, WI (1,392)
- 54821, WI (1,276)
- 54546, WI (1,266)
Data
Demographic, Population, Households, and Housing Units
** Data sources from census 2010 **
Show Data on Map
Download Full List as CSV
Download Quick Sheet as CSV
| Subject | This Area | Wisconsin | National |
|---|---|---|---|
| POPULATION | |||
| Total Population Map | 16,157 | 5,686,986 | 308,745,538 |
| POPULATION, HISPANIC OR LATINO ORIGIN | |||
| Not Hispanic or Latino Map | 15,855 | 5,350,930 | 258,267,944 |
| Hispanic or Latino Map | 302 | 336,056 | 50,477,594 |
| POPULATION, RACE | |||
| White alone Map | 13,662 | 4,902,067 | 223,553,265 |
| Black or African American alone Map | 48 | 359,148 | 38,929,319 |
| American Indian and Alaska Native alone Map | 1,791 | 54,526 | 2,932,248 |
| Asian alone Map | 59 | 129,234 | 14,674,252 |
| Native Hawaiian and Other Pacific Islander alone Map | 4 | 1,827 | 540,013 |
| Some Other Race alone Map | 56 | 135,867 | 19,107,368 |
| Two or More Races Map | 537 | 104,317 | 9,009,073 |
| POPULATION, SEX | |||
| Male Map | 8,082 | 2,822,400 | 151,781,326 |
| Female Map | 8,075 | 2,864,586 | 156,964,212 |
| POPULATION, AGE (18 YEARS) | |||
| 18 years and over Map | 12,413 | 4,347,494 | 234,564,071 |
| Under 18 years | 3,744 | 1,339,492 | 74,181,467 |
| POPULATION, AGE | |||
| Under 5 years | 1,001 | 358,443 | 20,201,362 |
| 5 to 9 years | 1,014 | 368,617 | 20,348,657 |
| 10 to 14 years | 1,084 | 375,927 | 20,677,194 |
| 15 to 17 years | 645 | 236,505 | 12,954,254 |
| 18 and 19 years | 491 | 162,704 | 9,086,089 |
| 20 years | 255 | 80,763 | 4,519,129 |
| 21 years | 274 | 78,216 | 4,354,294 |
| 22 to 24 years | 592 | 227,573 | 12,712,576 |
| 25 to 29 years | 948 | 372,347 | 21,101,849 |
| 30 to 34 years | 908 | 349,347 | 19,962,099 |
| 35 to 39 years | 806 | 345,328 | 20,179,642 |
| 40 to 44 years | 944 | 380,338 | 20,890,964 |
| 45 to 49 years | 1,236 | 437,627 | 22,708,591 |
| 50 to 54 years | 1,254 | 436,126 | 22,298,125 |
| 55 to 59 years | 1,167 | 385,986 | 19,664,805 |
| 60 and 61 years | 427 | 135,437 | 7,113,727 |
| 62 to 64 years | 544 | 178,388 | 9,704,197 |
| 65 and 66 years | 329 | 96,316 | 5,319,902 |
| 67 to 69 years | 424 | 130,713 | 7,115,361 |
| 70 to 74 years | 554 | 173,467 | 9,278,166 |
| 75 to 79 years | 444 | 141,252 | 7,317,795 |
| 80 to 84 years | 407 | 117,061 | 5,743,327 |
| 85 years and over | 409 | 118,505 | 5,493,433 |
| MEDIAN AGE BY SEX | |||
| Both sexes Map | 40.30 | 38.50 | 37.20 |
| Male Map | 39.00 | 37.30 | 35.80 |
| Female Map | 41.60 | 39.60 | 38.50 |
| HOUSEHOLDS | |||
| Total Households Map | 6,736 | 2,279,768 | 116,716,292 |
| HOUSEHOLDS, HOUSEHOLD TYPE | |||
| Family households: Map | 4,091 | 1,468,917 | 77,538,296 |
| Husband-wife family Map | 2,944 | 1,131,344 | 56,510,377 |
| Other family: Map | 1,147 | 337,573 | 21,027,919 |
| Male householder, no wife present Map | 366 | 103,625 | 5,777,570 |
| Female householder, no husband present Map | 781 | 233,948 | 15,250,349 |
| Nonfamily households: Map | 2,645 | 810,851 | 39,177,996 |
| Householder living alone Map | 2,184 | 642,507 | 31,204,909 |
| Householder not living alone Map | 461 | 168,344 | 7,973,087 |
| HOUSEHOLDS, HISPANIC OR LATINO ORIGIN OF HOUSEHOLDER | |||
| Not Hispanic or Latino householder: Map | 6,663 | 2,194,432 | 103,254,926 |
| Hispanic or Latino householder: Map | 73 | 85,336 | 13,461,366 |
| HOUSEHOLDS, RACE OF HOUSEHOLDER | |||
| Householder who is White alone | 5,927 | 2,045,544 | 89,754,352 |
| Householder who is Black or African American alone | 10 | 122,878 | 14,129,983 |
| Householder who is American Indian and Alaska Native alone | 608 | 18,213 | 939,707 |
| Householder who is Asian alone | 17 | 35,407 | 4,632,164 |
| Householder who is Native Hawaiian and Other Pacific Islander alone | 2 | 548 | 143,932 |
| Householder who is Some Other Race alone | 17 | 35,432 | 4,916,427 |
| Householder who is Two or More Races | 155 | 21,746 | 2,199,727 |
| HOUSEHOLDS, HOUSEHOLD TYPE BY HOUSEHOLD SIZE | |||
| Family households: Map | 4,091 | 1,468,917 | 77,538,296 |
| 2-person household Map | 2,043 | 680,856 | 31,882,616 |
| 3-person household Map | 876 | 319,637 | 17,765,829 |
| 4-person household Map | 675 | 276,516 | 15,214,075 |
| 5-person household Map | 305 | 121,740 | 7,411,997 |
| 6-person household Map | 99 | 43,643 | 3,026,278 |
| 7-or-more-person household Map | 93 | 26,525 | 2,237,501 |
| Nonfamily households: Map | 2,645 | 810,851 | 39,177,996 |
| 1-person household Map | 2,184 | 642,507 | 31,204,909 |
| 2-person household Map | 382 | 136,394 | 6,360,012 |
| 3-person household Map | 51 | 19,899 | 992,156 |
| 4-person household Map | 14 | 8,016 | 411,171 |
| 5-person household Map | 12 | 2,647 | 126,634 |
| 6-person household Map | 1 | 861 | 48,421 |
| 7-or-more-person household Map | 1 | 527 | 34,693 |
| HOUSING UNITS | |||
| Total Housing Units Map | 9,656 | 2,624,358 | 131,704,730 |
| HOUSING UNITS, OCCUPANCY STATUS | |||
| Occupied Map | 6,736 | 2,279,768 | 116,716,292 |
| Vacant Map | 2,920 | 344,590 | 14,988,438 |
| HOUSING UNITS, OCCUPIED, TENURE | |||
| Owned with a mortgage or a loan Map | 2,562 | 1,082,099 | 52,979,430 |
| Owned free and clear Map | 2,135 | 469,459 | 23,006,644 |
| Renter occupied Map | 2,039 | 728,210 | 40,730,218 |
| HOUSING UNITS, VACANT, VACANCY STATUS | |||
| For rent Map | 192 | 63,268 | 4,137,567 |
| Rented, not occupied Map | 29 | 3,695 | 206,825 |
| For sale only Map | 119 | 34,219 | 1,896,796 |
| Sold, not occupied Map | 23 | 5,741 | 421,032 |
| For seasonal, recreational, or occasional use Map | 2,284 | 193,046 | 4,649,298 |
| For migrant workers Map | 0 | 249 | 24,161 |
| Other vacant Map | 273 | 44,372 | 3,652,759 |
| HOUSING UNITS, OCCUPIED, AVERAGE HOUSEHOLD SIZE BY TENURE | |||
| Total: Map | 2.31 | 2.43 | 2.58 |
| Owner occupied Map | 2.41 | 2.56 | 2.65 |
| Renter occupied Map | 2.08 | 2.16 | 2.44 |
| HOUSING UNITS, OCCUPIED, TENURE BY RACE OF HOUSEHOLDER | |||
| Owner occupied: Map | 4,697 | 1,551,558 | 75,986,074 |
| Householder who is White alone Map | 4,287 | 1,466,172 | 63,446,275 |
| Householder who is Black or African American alone Map | 1 | 37,360 | 6,261,464 |
| Householder who is American Indian and Alaska Native alone Map | 306 | 8,742 | 509,588 |
| Householder who is Asian alone Map | 12 | 17,078 | 2,688,861 |
| Householder who is Native Hawaiian and Other Pacific Islander alone Map | 1 | 279 | 61,911 |
| Householder who is Some Other Race alone Map | 4 | 12,746 | 1,975,817 |
| Householder who is Two or More Races Map | 86 | 9,181 | 1,042,158 |
| Renter occupied: Map | 2,039 | 728,210 | 40,730,218 |
| Householder who is White alone Map | 1,640 | 579,372 | 26,308,077 |
| Householder who is Black or African American alone Map | 9 | 85,518 | 7,868,519 |
| Householder who is American Indian and Alaska Native alone Map | 302 | 9,471 | 430,119 |
| Householder who is Asian alone Map | 5 | 18,329 | 1,943,303 |
| Householder who is Native Hawaiian and Other Pacific Islander alone Map | 1 | 269 | 82,021 |
| Householder who is Some Other Race alone Map | 13 | 22,686 | 2,940,610 |
| Householder who is Two or More Races Map | 69 | 12,565 | 1,157,569 |
| HOUSING UNITS, OCCUPIED, TENURE BY HISPANIC OR LATINO ORIGIN OF HOUSEHOLDER | |||
| Owner occupied: Map | 4,697 | 1,551,558 | 75,986,074 |
| Not Hispanic or Latino householder Map | 4,666 | 1,516,656 | 69,617,625 |
| Hispanic or Latino householder Map | 31 | 34,902 | 6,368,449 |
| Renter occupied: Map | 2,039 | 728,210 | 40,730,218 |
| Not Hispanic or Latino householder Map | 1,997 | 677,776 | 33,637,301 |
| Hispanic or Latino householder Map | 42 | 50,434 | 7,092,917 |
| HOUSING UNITS, OCCUPIED, TENURE BY HOUSEHOLD SIZE | |||
| Owner occupied: Map | 4,697 | 1,551,558 | 75,986,074 |
| 1-person household Map | 1,227 | 325,993 | 16,453,569 |
| 2-person household Map | 1,917 | 623,027 | 27,618,605 |
| 3-person household Map | 657 | 241,709 | 12,517,563 |
| 4-person household Map | 520 | 220,084 | 10,998,793 |
| 5-person household Map | 236 | 91,979 | 5,057,765 |
| 6-person household Map | 73 | 31,002 | 1,965,796 |
| 7-or-more-person household Map | 67 | 17,764 | 1,373,983 |
| Renter occupied: Map | 2,039 | 728,210 | 40,730,218 |
| 1-person household Map | 957 | 316,514 | 14,751,340 |
| 2-person household Map | 508 | 194,223 | 10,624,023 |
| 3-person household Map | 270 | 97,827 | 6,240,422 |
| 4-person household Map | 169 | 64,448 | 4,626,453 |
| 5-person household Map | 81 | 32,408 | 2,480,866 |
| 6-person household Map | 27 | 13,502 | 1,108,903 |
| 7-or-more-person household Map | 27 | 9,288 | 898,211 |
Loading...