


Erie County, Pennsylvania
About
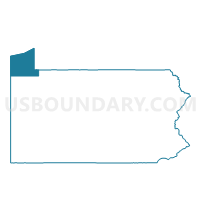
Outline

Summary
| Unique Area Identifier | 119276 |
| Name | Erie County |
| State | Pennsylvania |
| Area (square miles) | 1,558.23 |
| Land Area (square miles) | 799.15 |
| Water Area (square miles) | 759.08 |
| % of Land Area | 51.29 |
| % of Water Area | 48.71 |
| Latitude of the Internal Point | 42.11795190 |
| Longtitude of the Internal Point | -80.09638580 |
| Total Population | 280,566 |
| Total Housing Units | 119,138 |
| Total Households | 110,413 |
| Median Age | 38.6 |
Maps
Graphs
Select a template below for downloading or customizing gragh for Erie County, Pennsylvania


Neighbors
Neighoring County (by Name) Neighboring County on the Map
County Subdivision in Erie County (by Name) Neighboring County Subdivision on the Map
- Albion borough, Erie County, PA
- Amity township, Erie County, PA
- Concord township, Erie County, PA
- Conneaut township, Erie County, PA
- Corry city, Erie County, PA
- County subdivisions not defined, Erie County, PA
- Cranesville borough, Erie County, PA
- Edinboro borough, Erie County, PA
- Elgin borough, Erie County, PA
- Elk Creek township, Erie County, PA
- Erie city, Erie County, PA
- Fairview township, Erie County, PA
- Franklin township, Erie County, PA
- Girard borough, Erie County, PA
- Girard township, Erie County, PA
- Greene township, Erie County, PA
- Greenfield township, Erie County, PA
- Harborcreek township, Erie County, PA
- Lake City borough, Erie County, PA
- Lawrence Park township, Erie County, PA
- LeBoeuf township, Erie County, PA
- McKean borough, Erie County, PA
- McKean township, Erie County, PA
- Mill Village borough, Erie County, PA
- Millcreek township, Erie County, PA
- North East borough, Erie County, PA
- North East township, Erie County, PA
- Platea borough, Erie County, PA
- Springfield township, Erie County, PA
- Summit township, Erie County, PA
- Union township, Erie County, PA
- Union City borough, Erie County, PA
- Venango township, Erie County, PA
- Washington township, Erie County, PA
- Waterford borough, Erie County, PA
- Waterford township, Erie County, PA
- Wattsburg borough, Erie County, PA
- Wayne township, Erie County, PA
- Wesleyville borough, Erie County, PA
Top 10 Neighboring Place (by Population) Neighboring Place on the Map
- Erie city, PA (101,786)
- Conneaut city, OH (12,841)
- Northwest Harborcreek CDP, PA (8,949)
- Corry city, PA (6,605)
- Edinboro borough, PA (6,438)
- North East borough, PA (4,294)
- Lawrence Park CDP, PA (3,982)
- Wesleyville borough, PA (3,341)
- Union City borough, PA (3,320)
- Girard borough, PA (3,104)
Top 10 Neighboring Unified School District (by Population) Neighboring Unified School District on the Map
- Erie City School District, PA (101,798)
- Millcreek Township School District, PA (53,503)
- Penncrest School District, PA (24,644)
- Conneaut School District, PA (18,617)
- General McLane School District, PA (17,300)
- Harbor Creek School District, PA (17,234)
- Corry Area School District, PA (14,849)
- Conneaut Area City School District, OH (14,670)
- Fort LeBoeuf School District, PA (14,150)
- Northwestern School District, PA (12,097)
Top 10 Neighboring State Legislative District Lower Chamber (by Population) Neighboring State Legislative District Lower Chamber on the Map
- Assembly District 150, NY (121,520)
- State House District 99, OH (108,338)
- State House District 2, PA (62,337)
- State House District 3, PA (60,723)
- State House District 65, PA (59,457)
- State House District 4, PA (58,468)
- State House District 6, PA (58,259)
- State House District 5, PA (58,143)
- State House District 1, PA (55,982)
- State House Districts not defined, OH (0)
Top 10 Neighboring State Legislative District Upper Chamber (by Population) Neighboring State Legislative District Upper Chamber on the Map
- State Senate District 32, OH (311,809)
- State Senate District 57, NY (285,036)
- State Senate District 49, PA (241,903)
- State Senate District 50, PA (235,966)
- State Senate District 21, PA (235,571)
- State Senate Districts not defined, OH (0)
Top 10 Neighboring 111th Congressional District (by Population) Neighboring 111th Congressional District on the Map
- Congressional District 14, OH (648,128)
- Congressional District 3, PA (640,356)
- Congressional District 27, NY (629,271)
Top 10 Census Tract in Erie County (by Population) Neighboring Census Tract on the Map
- Census Tract 123, Erie County, PA (7,783)
- Census Tract 121, Erie County, PA (7,547)
- Census Tract 28, Erie County, PA (7,462)
- Census Tract 27, Erie County, PA (6,817)
- Census Tract 109.03, Erie County, PA (6,722)
- Census Tract 119, Erie County, PA (6,605)
- Census Tract 112.02, Erie County, PA (6,603)
- Census Tract 110.01, Erie County, PA (6,577)
- Census Tract 122.02, Erie County, PA (6,438)
- Census Tract 102.01, Erie County, PA (6,145)
Top 10 Neighboring 5-Digit ZIP Code Tabulation Area (by Population) Neighboring 5-Digit ZIP Code Tabulation Area on the Map
- 16509, PA (26,810)
- 16510, PA (25,625)
- 16506, PA (23,720)
- 16504, PA (17,322)
- 16505, PA (17,168)
- 16503, PA (16,850)
- 16502, PA (16,664)
- 44030, OH (16,652)
- 16508, PA (16,050)
- 16428, PA (12,478)
Data
Demographic, Population, Households, and Housing Units
** Data sources from census 2010 **
Show Data on Map
Download Full List as CSV
Download Quick Sheet as CSV
| Subject | This Area | Pennsylvania | National |
|---|---|---|---|
| POPULATION | |||
| Total Population Map | 280,566 | 12,702,379 | 308,745,538 |
| POPULATION, HISPANIC OR LATINO ORIGIN | |||
| Not Hispanic or Latino Map | 271,048 | 11,982,719 | 258,267,944 |
| Hispanic or Latino Map | 9,518 | 719,660 | 50,477,594 |
| POPULATION, RACE | |||
| White alone Map | 247,569 | 10,406,288 | 223,553,265 |
| Black or African American alone Map | 20,155 | 1,377,689 | 38,929,319 |
| American Indian and Alaska Native alone Map | 566 | 26,843 | 2,932,248 |
| Asian alone Map | 3,077 | 349,088 | 14,674,252 |
| Native Hawaiian and Other Pacific Islander alone Map | 90 | 3,653 | 540,013 |
| Some Other Race alone Map | 3,231 | 300,983 | 19,107,368 |
| Two or More Races Map | 5,878 | 237,835 | 9,009,073 |
| POPULATION, SEX | |||
| Male Map | 137,957 | 6,190,363 | 151,781,326 |
| Female Map | 142,609 | 6,512,016 | 156,964,212 |
| POPULATION, AGE (18 YEARS) | |||
| 18 years and over Map | 216,758 | 9,910,224 | 234,564,071 |
| Under 18 years | 63,808 | 2,792,155 | 74,181,467 |
| POPULATION, AGE | |||
| Under 5 years | 16,757 | 729,538 | 20,201,362 |
| 5 to 9 years | 17,067 | 753,635 | 20,348,657 |
| 10 to 14 years | 18,012 | 791,151 | 20,677,194 |
| 15 to 17 years | 11,972 | 517,831 | 12,954,254 |
| 18 and 19 years | 10,333 | 387,235 | 9,086,089 |
| 20 years | 5,294 | 191,942 | 4,519,129 |
| 21 years | 4,918 | 183,257 | 4,354,294 |
| 22 to 24 years | 12,137 | 498,947 | 12,712,576 |
| 25 to 29 years | 17,210 | 781,527 | 21,101,849 |
| 30 to 34 years | 15,496 | 729,592 | 19,962,099 |
| 35 to 39 years | 16,125 | 764,287 | 20,179,642 |
| 40 to 44 years | 17,758 | 851,382 | 20,890,964 |
| 45 to 49 years | 19,749 | 955,763 | 22,708,591 |
| 50 to 54 years | 21,476 | 984,641 | 22,298,125 |
| 55 to 59 years | 19,854 | 879,048 | 19,664,805 |
| 60 and 61 years | 6,679 | 312,575 | 7,113,727 |
| 62 to 64 years | 8,905 | 430,721 | 9,704,197 |
| 65 and 66 years | 4,874 | 231,623 | 5,319,902 |
| 67 to 69 years | 6,726 | 321,379 | 7,115,361 |
| 70 to 74 years | 8,827 | 426,536 | 9,278,166 |
| 75 to 79 years | 7,150 | 362,332 | 7,317,795 |
| 80 to 84 years | 6,535 | 311,761 | 5,743,327 |
| 85 years and over | 6,712 | 305,676 | 5,493,433 |
| MEDIAN AGE BY SEX | |||
| Both sexes Map | 38.60 | 40.10 | 37.20 |
| Male Map | 37.10 | 38.70 | 35.80 |
| Female Map | 39.90 | 41.50 | 38.50 |
| HOUSEHOLDS | |||
| Total Households Map | 110,413 | 5,018,904 | 116,716,292 |
| HOUSEHOLDS, HOUSEHOLD TYPE | |||
| Family households: Map | 70,196 | 3,261,307 | 77,538,296 |
| Husband-wife family Map | 50,093 | 2,417,765 | 56,510,377 |
| Other family: Map | 20,103 | 843,542 | 21,027,919 |
| Male householder, no wife present Map | 5,519 | 229,495 | 5,777,570 |
| Female householder, no husband present Map | 14,584 | 614,047 | 15,250,349 |
| Nonfamily households: Map | 40,217 | 1,757,597 | 39,177,996 |
| Householder living alone Map | 32,373 | 1,433,415 | 31,204,909 |
| Householder not living alone Map | 7,844 | 324,182 | 7,973,087 |
| HOUSEHOLDS, HISPANIC OR LATINO ORIGIN OF HOUSEHOLDER | |||
| Not Hispanic or Latino householder: Map | 107,923 | 4,823,358 | 103,254,926 |
| Hispanic or Latino householder: Map | 2,490 | 195,546 | 13,461,366 |
| HOUSEHOLDS, RACE OF HOUSEHOLDER | |||
| Householder who is White alone | 100,833 | 4,264,337 | 89,754,352 |
| Householder who is Black or African American alone | 6,416 | 498,966 | 14,129,983 |
| Householder who is American Indian and Alaska Native alone | 244 | 9,573 | 939,707 |
| Householder who is Asian alone | 939 | 109,060 | 4,632,164 |
| Householder who is Native Hawaiian and Other Pacific Islander alone | 19 | 1,127 | 143,932 |
| Householder who is Some Other Race alone | 906 | 82,237 | 4,916,427 |
| Householder who is Two or More Races | 1,056 | 53,604 | 2,199,727 |
| HOUSEHOLDS, HOUSEHOLD TYPE BY HOUSEHOLD SIZE | |||
| Family households: Map | 70,196 | 3,261,307 | 77,538,296 |
| 2-person household Map | 31,294 | 1,442,819 | 31,882,616 |
| 3-person household Map | 16,297 | 767,169 | 17,765,829 |
| 4-person household Map | 13,206 | 620,755 | 15,214,075 |
| 5-person household Map | 5,853 | 271,611 | 7,411,997 |
| 6-person household Map | 2,229 | 98,268 | 3,026,278 |
| 7-or-more-person household Map | 1,317 | 60,685 | 2,237,501 |
| Nonfamily households: Map | 40,217 | 1,757,597 | 39,177,996 |
| 1-person household Map | 32,373 | 1,433,415 | 31,204,909 |
| 2-person household Map | 6,188 | 262,684 | 6,360,012 |
| 3-person household Map | 1,063 | 36,955 | 992,156 |
| 4-person household Map | 445 | 16,687 | 411,171 |
| 5-person household Map | 100 | 4,799 | 126,634 |
| 6-person household Map | 28 | 1,720 | 48,421 |
| 7-or-more-person household Map | 20 | 1,337 | 34,693 |
| HOUSING UNITS | |||
| Total Housing Units Map | 119,138 | 5,567,315 | 131,704,730 |
| HOUSING UNITS, OCCUPANCY STATUS | |||
| Occupied Map | 110,413 | 5,018,904 | 116,716,292 |
| Vacant Map | 8,725 | 548,411 | 14,988,438 |
| HOUSING UNITS, OCCUPIED, TENURE | |||
| Owned with a mortgage or a loan Map | 46,681 | 2,268,674 | 52,979,430 |
| Owned free and clear Map | 27,166 | 1,223,048 | 23,006,644 |
| Renter occupied Map | 36,566 | 1,527,182 | 40,730,218 |
| HOUSING UNITS, VACANT, VACANCY STATUS | |||
| For rent Map | 2,771 | 135,262 | 4,137,567 |
| Rented, not occupied Map | 149 | 9,386 | 206,825 |
| For sale only Map | 1,159 | 64,818 | 1,896,796 |
| Sold, not occupied Map | 332 | 20,131 | 421,032 |
| For seasonal, recreational, or occasional use Map | 1,628 | 161,582 | 4,649,298 |
| For migrant workers Map | 2 | 411 | 24,161 |
| Other vacant Map | 2,684 | 156,821 | 3,652,759 |
| HOUSING UNITS, OCCUPIED, AVERAGE HOUSEHOLD SIZE BY TENURE | |||
| Total: Map | 2.42 | 2.45 | 2.58 |
| Owner occupied Map | 2.55 | 2.57 | 2.65 |
| Renter occupied Map | 2.16 | 2.16 | 2.44 |
| HOUSING UNITS, OCCUPIED, TENURE BY RACE OF HOUSEHOLDER | |||
| Owner occupied: Map | 73,847 | 3,491,722 | 75,986,074 |
| Householder who is White alone Map | 70,542 | 3,140,005 | 63,446,275 |
| Householder who is Black or African American alone Map | 2,106 | 228,851 | 6,261,464 |
| Householder who is American Indian and Alaska Native alone Map | 100 | 4,562 | 509,588 |
| Householder who is Asian alone Map | 412 | 62,204 | 2,688,861 |
| Householder who is Native Hawaiian and Other Pacific Islander alone Map | 11 | 544 | 61,911 |
| Householder who is Some Other Race alone Map | 310 | 30,761 | 1,975,817 |
| Householder who is Two or More Races Map | 366 | 24,795 | 1,042,158 |
| Renter occupied: Map | 36,566 | 1,527,182 | 40,730,218 |
| Householder who is White alone Map | 30,291 | 1,124,332 | 26,308,077 |
| Householder who is Black or African American alone Map | 4,310 | 270,115 | 7,868,519 |
| Householder who is American Indian and Alaska Native alone Map | 144 | 5,011 | 430,119 |
| Householder who is Asian alone Map | 527 | 46,856 | 1,943,303 |
| Householder who is Native Hawaiian and Other Pacific Islander alone Map | 8 | 583 | 82,021 |
| Householder who is Some Other Race alone Map | 596 | 51,476 | 2,940,610 |
| Householder who is Two or More Races Map | 690 | 28,809 | 1,157,569 |
| HOUSING UNITS, OCCUPIED, TENURE BY HISPANIC OR LATINO ORIGIN OF HOUSEHOLDER | |||
| Owner occupied: Map | 73,847 | 3,491,722 | 75,986,074 |
| Not Hispanic or Latino householder Map | 73,001 | 3,408,824 | 69,617,625 |
| Hispanic or Latino householder Map | 846 | 82,898 | 6,368,449 |
| Renter occupied: Map | 36,566 | 1,527,182 | 40,730,218 |
| Not Hispanic or Latino householder Map | 34,922 | 1,414,534 | 33,637,301 |
| Hispanic or Latino householder Map | 1,644 | 112,648 | 7,092,917 |
| HOUSING UNITS, OCCUPIED, TENURE BY HOUSEHOLD SIZE | |||
| Owner occupied: Map | 73,847 | 3,491,722 | 75,986,074 |
| 1-person household Map | 16,285 | 767,169 | 16,453,569 |
| 2-person household Map | 28,206 | 1,304,206 | 27,618,605 |
| 3-person household Map | 12,245 | 596,731 | 12,517,563 |
| 4-person household Map | 10,292 | 499,363 | 10,998,793 |
| 5-person household Map | 4,382 | 210,370 | 5,057,765 |
| 6-person household Map | 1,564 | 72,113 | 1,965,796 |
| 7-or-more-person household Map | 873 | 41,770 | 1,373,983 |
| Renter occupied: Map | 36,566 | 1,527,182 | 40,730,218 |
| 1-person household Map | 16,088 | 666,246 | 14,751,340 |
| 2-person household Map | 9,276 | 401,297 | 10,624,023 |
| 3-person household Map | 5,115 | 207,393 | 6,240,422 |
| 4-person household Map | 3,359 | 138,079 | 4,626,453 |
| 5-person household Map | 1,571 | 66,040 | 2,480,866 |
| 6-person household Map | 693 | 27,875 | 1,108,903 |
| 7-or-more-person household Map | 464 | 20,252 | 898,211 |
Loading...