


Chester County, Pennsylvania
About
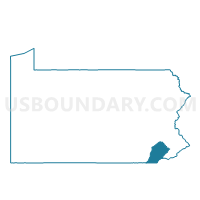
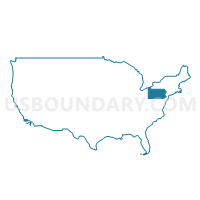
Outline

Summary
| Unique Area Identifier | 119432 |
| Name | Chester County |
| State | Pennsylvania |
| Area (square miles) | 759.23 |
| Land Area (square miles) | 750.51 |
| Water Area (square miles) | 8.73 |
| % of Land Area | 98.85 |
| % of Water Area | 1.15 |
| Latitude of the Internal Point | 39.97396540 |
| Longtitude of the Internal Point | -75.74973230 |
| Total Population | 498,886 |
| Total Housing Units | 192,462 |
| Total Households | 182,900 |
| Median Age | 39.3 |
Maps
Graphs
Select a template below for downloading or customizing gragh for Chester County, Pennsylvania


Neighbors
Neighoring County (by Name) Neighboring County on the Map
- Berks County, PA
- Cecil County, MD
- Delaware County, PA
- Lancaster County, PA
- Montgomery County, PA
- New Castle County, DE
County Subdivision in Chester County (by Name) Neighboring County Subdivision on the Map
- Atglen borough, Chester County, PA
- Avondale borough, Chester County, PA
- Birmingham township, Chester County, PA
- Caln township, Chester County, PA
- Charlestown township, Chester County, PA
- Coatesville city, Chester County, PA
- Downingtown borough, Chester County, PA
- East Bradford township, Chester County, PA
- East Brandywine township, Chester County, PA
- East Caln township, Chester County, PA
- East Coventry township, Chester County, PA
- East Fallowfield township, Chester County, PA
- East Goshen township, Chester County, PA
- East Marlborough township, Chester County, PA
- East Nantmeal township, Chester County, PA
- East Nottingham township, Chester County, PA
- East Pikeland township, Chester County, PA
- East Vincent township, Chester County, PA
- East Whiteland township, Chester County, PA
- Easttown township, Chester County, PA
- Elk township, Chester County, PA
- Elverson borough, Chester County, PA
- Franklin township, Chester County, PA
- Highland township, Chester County, PA
- Honey Brook borough, Chester County, PA
- Honey Brook township, Chester County, PA
- Kennett township, Chester County, PA
- Kennett Square borough, Chester County, PA
- London Britain township, Chester County, PA
- London Grove township, Chester County, PA
- Londonderry township, Chester County, PA
- Lower Oxford township, Chester County, PA
- Malvern borough, Chester County, PA
- Modena borough, Chester County, PA
- New Garden township, Chester County, PA
- New London township, Chester County, PA
- Newlin township, Chester County, PA
- North Coventry township, Chester County, PA
- Oxford borough, Chester County, PA
- Parkesburg borough, Chester County, PA
- Penn township, Chester County, PA
- Pennsbury township, Chester County, PA
- Phoenixville borough, Chester County, PA
- Pocopson township, Chester County, PA
- Sadsbury township, Chester County, PA
- Schuylkill township, Chester County, PA
- South Coatesville borough, Chester County, PA
- South Coventry township, Chester County, PA
- Spring City borough, Chester County, PA
- Thornbury township, Chester County, PA
- Tredyffrin township, Chester County, PA
- Upper Oxford township, Chester County, PA
- Upper Uwchlan township, Chester County, PA
- Uwchlan township, Chester County, PA
- Valley township, Chester County, PA
- Wallace township, Chester County, PA
- Warwick township, Chester County, PA
- West Bradford township, Chester County, PA
- West Brandywine township, Chester County, PA
- West Caln township, Chester County, PA
- West Chester borough, Chester County, PA
- West Fallowfield township, Chester County, PA
- West Goshen township, Chester County, PA
- West Grove borough, Chester County, PA
- West Marlborough township, Chester County, PA
- West Nantmeal township, Chester County, PA
- West Nottingham township, Chester County, PA
- West Pikeland township, Chester County, PA
- West Sadsbury township, Chester County, PA
- West Vincent township, Chester County, PA
- West Whiteland township, Chester County, PA
- Westtown township, Chester County, PA
- Willistown township, Chester County, PA
Top 10 Neighboring Place (by Population) Neighboring Place on the Map
- Pottstown borough, PA (22,377)
- King of Prussia CDP, PA (19,936)
- West Chester borough, PA (18,461)
- Phoenixville borough, PA (16,440)
- Hockessin CDP, DE (13,527)
- Coatesville city, PA (13,100)
- North Star CDP, DE (7,980)
- Downingtown borough, PA (7,891)
- Lionville CDP, PA (6,189)
- Kennett Square borough, PA (6,072)
Top 10 Neighboring Unified School District (by Population) Neighboring Unified School District on the Map
- Christina School District, DE (170,139)
- Red Clay Consolidated School District, DE (138,228)
- West Chester Area School District, PA (108,433)
- Cecil County Public Schools, MD (101,108)
- Downingtown Area School District, PA (68,499)
- Coatesville Area School District, PA (62,979)
- Spring-Ford Area School District, PA (47,368)
- Boyertown Area School District, PA (46,133)
- Tredyffrin-Easttown School District, PA (39,809)
- Marple Newtown School District, PA (35,644)
Top 10 Neighboring State Legislative District Lower Chamber (by Population) Neighboring State Legislative District Lower Chamber on the Map
- State House District 13, PA (77,777)
- State House District 26, PA (74,084)
- State House District 160, PA (73,500)
- State House District 150, PA (71,936)
- State House District 155, PA (71,402)
- State House District 146, PA (70,472)
- State House District 130, PA (70,334)
- State House District 158, PA (68,769)
- State House District 128, PA (67,410)
- State House District 157, PA (67,043)
Top 10 Neighboring State Legislative District Upper Chamber (by Population) Neighboring State Legislative District Upper Chamber on the Map
- State Senate District 44, PA (288,673)
- State Senate District 19, PA (280,974)
- State Senate District 48, PA (278,934)
- State Senate District 9, PA (277,401)
- State Senate District 36, PA (275,192)
- State Senate District 13, PA (272,163)
- State Senate District 11, PA (269,402)
- State Senate District 26, PA (251,041)
- State Senate District 17, PA (248,670)
- State Senate District 34, MD (131,492)
Top 10 Neighboring 111th Congressional District (by Population) Neighboring 111th Congressional District on the Map
- Congressional District (at Large), DE (897,934)
- Congressional District 1, MD (744,275)
- Congressional District 6, PA (726,465)
- Congressional District 16, PA (723,977)
- Congressional District 15, PA (721,828)
- Congressional District 7, PA (673,623)
Top 10 Census Tract in Chester County (by Population) Neighboring Census Tract on the Map
- Census Tract 3117, Chester County, PA (8,740)
- Census Tract 3038.02, Chester County, PA (8,182)
- Census Tract 3045.01, Chester County, PA (8,089)
- Census Tract 3049, Chester County, PA (7,647)
- Census Tract 3060, Chester County, PA (7,449)
- Census Tract 3010, Chester County, PA (7,079)
- Census Tract 3028.05, Chester County, PA (6,956)
- Census Tract 3114.01, Chester County, PA (6,937)
- Census Tract 3022.02, Chester County, PA (6,899)
- Census Tract 3042.01, Chester County, PA (6,880)
Top 10 Neighboring 5-Digit ZIP Code Tabulation Area (by Population) Neighboring 5-Digit ZIP Code Tabulation Area on the Map
- 19382, PA (52,388)
- 19320, PA (52,342)
- 19711, DE (51,322)
- 19380, PA (49,534)
- 19335, PA (46,984)
- 19464, PA (45,788)
- 21921, MD (44,471)
- 19460, PA (40,154)
- 19087, PA (32,225)
- 19468, PA (25,536)
Data
Demographic, Population, Households, and Housing Units
** Data sources from census 2010 **
Show Data on Map
Download Full List as CSV
Download Quick Sheet as CSV
| Subject | This Area | Pennsylvania | National |
|---|---|---|---|
| POPULATION | |||
| Total Population Map | 498,886 | 12,702,379 | 308,745,538 |
| POPULATION, HISPANIC OR LATINO ORIGIN | |||
| Not Hispanic or Latino Map | 466,383 | 11,982,719 | 258,267,944 |
| Hispanic or Latino Map | 32,503 | 719,660 | 50,477,594 |
| POPULATION, RACE | |||
| White alone Map | 426,707 | 10,406,288 | 223,553,265 |
| Black or African American alone Map | 30,623 | 1,377,689 | 38,929,319 |
| American Indian and Alaska Native alone Map | 862 | 26,843 | 2,932,248 |
| Asian alone Map | 19,296 | 349,088 | 14,674,252 |
| Native Hawaiian and Other Pacific Islander alone Map | 161 | 3,653 | 540,013 |
| Some Other Race alone Map | 12,207 | 300,983 | 19,107,368 |
| Two or More Races Map | 9,030 | 237,835 | 9,009,073 |
| POPULATION, SEX | |||
| Male Map | 245,161 | 6,190,363 | 151,781,326 |
| Female Map | 253,725 | 6,512,016 | 156,964,212 |
| POPULATION, AGE (18 YEARS) | |||
| 18 years and over Map | 374,831 | 9,910,224 | 234,564,071 |
| Under 18 years | 124,055 | 2,792,155 | 74,181,467 |
| POPULATION, AGE | |||
| Under 5 years | 31,126 | 729,538 | 20,201,362 |
| 5 to 9 years | 34,929 | 753,635 | 20,348,657 |
| 10 to 14 years | 35,717 | 791,151 | 20,677,194 |
| 15 to 17 years | 22,283 | 517,831 | 12,954,254 |
| 18 and 19 years | 14,118 | 387,235 | 9,086,089 |
| 20 years | 6,481 | 191,942 | 4,519,129 |
| 21 years | 6,209 | 183,257 | 4,354,294 |
| 22 to 24 years | 17,594 | 498,947 | 12,712,576 |
| 25 to 29 years | 27,323 | 781,527 | 21,101,849 |
| 30 to 34 years | 27,150 | 729,592 | 19,962,099 |
| 35 to 39 years | 31,765 | 764,287 | 20,179,642 |
| 40 to 44 years | 37,168 | 851,382 | 20,890,964 |
| 45 to 49 years | 41,458 | 955,763 | 22,708,591 |
| 50 to 54 years | 40,118 | 984,641 | 22,298,125 |
| 55 to 59 years | 33,997 | 879,048 | 19,664,805 |
| 60 and 61 years | 11,435 | 312,575 | 7,113,727 |
| 62 to 64 years | 16,140 | 430,721 | 9,704,197 |
| 65 and 66 years | 8,706 | 231,623 | 5,319,902 |
| 67 to 69 years | 11,304 | 321,379 | 7,115,361 |
| 70 to 74 years | 14,006 | 426,536 | 9,278,166 |
| 75 to 79 years | 11,293 | 362,332 | 7,317,795 |
| 80 to 84 years | 9,299 | 311,761 | 5,743,327 |
| 85 years and over | 9,267 | 305,676 | 5,493,433 |
| MEDIAN AGE BY SEX | |||
| Both sexes Map | 39.30 | 40.10 | 37.20 |
| Male Map | 38.10 | 38.70 | 35.80 |
| Female Map | 40.30 | 41.50 | 38.50 |
| HOUSEHOLDS | |||
| Total Households Map | 182,900 | 5,018,904 | 116,716,292 |
| HOUSEHOLDS, HOUSEHOLD TYPE | |||
| Family households: Map | 129,138 | 3,261,307 | 77,538,296 |
| Husband-wife family Map | 107,144 | 2,417,765 | 56,510,377 |
| Other family: Map | 21,994 | 843,542 | 21,027,919 |
| Male householder, no wife present Map | 6,472 | 229,495 | 5,777,570 |
| Female householder, no husband present Map | 15,522 | 614,047 | 15,250,349 |
| Nonfamily households: Map | 53,762 | 1,757,597 | 39,177,996 |
| Householder living alone Map | 42,032 | 1,433,415 | 31,204,909 |
| Householder not living alone Map | 11,730 | 324,182 | 7,973,087 |
| HOUSEHOLDS, HISPANIC OR LATINO ORIGIN OF HOUSEHOLDER | |||
| Not Hispanic or Latino householder: Map | 175,657 | 4,823,358 | 103,254,926 |
| Hispanic or Latino householder: Map | 7,243 | 195,546 | 13,461,366 |
| HOUSEHOLDS, RACE OF HOUSEHOLDER | |||
| Householder who is White alone | 162,141 | 4,264,337 | 89,754,352 |
| Householder who is Black or African American alone | 10,251 | 498,966 | 14,129,983 |
| Householder who is American Indian and Alaska Native alone | 261 | 9,573 | 939,707 |
| Householder who is Asian alone | 5,887 | 109,060 | 4,632,164 |
| Householder who is Native Hawaiian and Other Pacific Islander alone | 42 | 1,127 | 143,932 |
| Householder who is Some Other Race alone | 2,679 | 82,237 | 4,916,427 |
| Householder who is Two or More Races | 1,639 | 53,604 | 2,199,727 |
| HOUSEHOLDS, HOUSEHOLD TYPE BY HOUSEHOLD SIZE | |||
| Family households: Map | 129,138 | 3,261,307 | 77,538,296 |
| 2-person household Map | 51,862 | 1,442,819 | 31,882,616 |
| 3-person household Map | 28,770 | 767,169 | 17,765,829 |
| 4-person household Map | 28,909 | 620,755 | 15,214,075 |
| 5-person household Map | 12,858 | 271,611 | 7,411,997 |
| 6-person household Map | 4,283 | 98,268 | 3,026,278 |
| 7-or-more-person household Map | 2,456 | 60,685 | 2,237,501 |
| Nonfamily households: Map | 53,762 | 1,757,597 | 39,177,996 |
| 1-person household Map | 42,032 | 1,433,415 | 31,204,909 |
| 2-person household Map | 9,165 | 262,684 | 6,360,012 |
| 3-person household Map | 1,249 | 36,955 | 992,156 |
| 4-person household Map | 960 | 16,687 | 411,171 |
| 5-person household Map | 194 | 4,799 | 126,634 |
| 6-person household Map | 77 | 1,720 | 48,421 |
| 7-or-more-person household Map | 85 | 1,337 | 34,693 |
| HOUSING UNITS | |||
| Total Housing Units Map | 192,462 | 5,567,315 | 131,704,730 |
| HOUSING UNITS, OCCUPANCY STATUS | |||
| Occupied Map | 182,900 | 5,018,904 | 116,716,292 |
| Vacant Map | 9,562 | 548,411 | 14,988,438 |
| HOUSING UNITS, OCCUPIED, TENURE | |||
| Owned with a mortgage or a loan Map | 105,549 | 2,268,674 | 52,979,430 |
| Owned free and clear Map | 33,779 | 1,223,048 | 23,006,644 |
| Renter occupied Map | 43,572 | 1,527,182 | 40,730,218 |
| HOUSING UNITS, VACANT, VACANCY STATUS | |||
| For rent Map | 3,672 | 135,262 | 4,137,567 |
| Rented, not occupied Map | 224 | 9,386 | 206,825 |
| For sale only Map | 2,086 | 64,818 | 1,896,796 |
| Sold, not occupied Map | 507 | 20,131 | 421,032 |
| For seasonal, recreational, or occasional use Map | 1,064 | 161,582 | 4,649,298 |
| For migrant workers Map | 12 | 411 | 24,161 |
| Other vacant Map | 1,997 | 156,821 | 3,652,759 |
| HOUSING UNITS, OCCUPIED, AVERAGE HOUSEHOLD SIZE BY TENURE | |||
| Total: Map | 2.65 | 2.45 | 2.58 |
| Owner occupied Map | 2.77 | 2.57 | 2.65 |
| Renter occupied Map | 2.28 | 2.16 | 2.44 |
| HOUSING UNITS, OCCUPIED, TENURE BY RACE OF HOUSEHOLDER | |||
| Owner occupied: Map | 139,328 | 3,491,722 | 75,986,074 |
| Householder who is White alone Map | 128,463 | 3,140,005 | 63,446,275 |
| Householder who is Black or African American alone Map | 4,855 | 228,851 | 6,261,464 |
| Householder who is American Indian and Alaska Native alone Map | 151 | 4,562 | 509,588 |
| Householder who is Asian alone Map | 4,178 | 62,204 | 2,688,861 |
| Householder who is Native Hawaiian and Other Pacific Islander alone Map | 17 | 544 | 61,911 |
| Householder who is Some Other Race alone Map | 782 | 30,761 | 1,975,817 |
| Householder who is Two or More Races Map | 882 | 24,795 | 1,042,158 |
| Renter occupied: Map | 43,572 | 1,527,182 | 40,730,218 |
| Householder who is White alone Map | 33,678 | 1,124,332 | 26,308,077 |
| Householder who is Black or African American alone Map | 5,396 | 270,115 | 7,868,519 |
| Householder who is American Indian and Alaska Native alone Map | 110 | 5,011 | 430,119 |
| Householder who is Asian alone Map | 1,709 | 46,856 | 1,943,303 |
| Householder who is Native Hawaiian and Other Pacific Islander alone Map | 25 | 583 | 82,021 |
| Householder who is Some Other Race alone Map | 1,897 | 51,476 | 2,940,610 |
| Householder who is Two or More Races Map | 757 | 28,809 | 1,157,569 |
| HOUSING UNITS, OCCUPIED, TENURE BY HISPANIC OR LATINO ORIGIN OF HOUSEHOLDER | |||
| Owner occupied: Map | 139,328 | 3,491,722 | 75,986,074 |
| Not Hispanic or Latino householder Map | 136,456 | 3,408,824 | 69,617,625 |
| Hispanic or Latino householder Map | 2,872 | 82,898 | 6,368,449 |
| Renter occupied: Map | 43,572 | 1,527,182 | 40,730,218 |
| Not Hispanic or Latino householder Map | 39,201 | 1,414,534 | 33,637,301 |
| Hispanic or Latino householder Map | 4,371 | 112,648 | 7,092,917 |
| HOUSING UNITS, OCCUPIED, TENURE BY HOUSEHOLD SIZE | |||
| Owner occupied: Map | 139,328 | 3,491,722 | 75,986,074 |
| 1-person household Map | 24,397 | 767,169 | 16,453,569 |
| 2-person household Map | 49,042 | 1,304,206 | 27,618,605 |
| 3-person household Map | 24,350 | 596,731 | 12,517,563 |
| 4-person household Map | 25,351 | 499,363 | 10,998,793 |
| 5-person household Map | 11,019 | 210,370 | 5,057,765 |
| 6-person household Map | 3,454 | 72,113 | 1,965,796 |
| 7-or-more-person household Map | 1,715 | 41,770 | 1,373,983 |
| Renter occupied: Map | 43,572 | 1,527,182 | 40,730,218 |
| 1-person household Map | 17,635 | 666,246 | 14,751,340 |
| 2-person household Map | 11,985 | 401,297 | 10,624,023 |
| 3-person household Map | 5,669 | 207,393 | 6,240,422 |
| 4-person household Map | 4,518 | 138,079 | 4,626,453 |
| 5-person household Map | 2,033 | 66,040 | 2,480,866 |
| 6-person household Map | 906 | 27,875 | 1,108,903 |
| 7-or-more-person household Map | 826 | 20,252 | 898,211 |
Loading...