


St. Clair County, Michigan
About
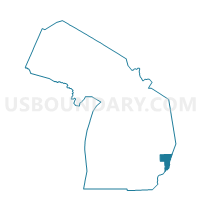
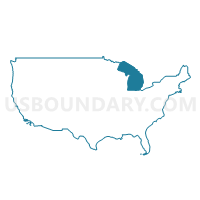
Outline

Summary
| Unique Area Identifier | 120286 |
| Name | St. Clair County |
| State | Michigan |
| Area (square miles) | 836.51 |
| Land Area (square miles) | 721.17 |
| Water Area (square miles) | 115.34 |
| % of Land Area | 86.21 |
| % of Water Area | 13.79 |
| Latitude of the Internal Point | 42.92880350 |
| Longtitude of the Internal Point | -82.66891350 |
| Total Population | 163,040 |
| Total Housing Units | 71,822 |
| Total Households | 63,841 |
| Median Age | 41.3 |
Maps
Graphs
Select a template below for downloading or customizing gragh for St. Clair County, Michigan


Neighbors
Neighoring County (by Name) Neighboring County on the Map
County Subdivision in St. Clair County (by Name) Neighboring County Subdivision on the Map
- Algonac city, St. Clair County, MI
- Berlin township, St. Clair County, MI
- Brockway township, St. Clair County, MI
- Burtchville township, St. Clair County, MI
- Casco township, St. Clair County, MI
- China township, St. Clair County, MI
- Clay township, St. Clair County, MI
- Clyde township, St. Clair County, MI
- Columbus township, St. Clair County, MI
- Cottrellville township, St. Clair County, MI
- County subdivisions not defined, St. Clair County, MI
- East China township, St. Clair County, MI
- Emmett township, St. Clair County, MI
- Fort Gratiot charter township, St. Clair County, MI
- Grant township, St. Clair County, MI
- Greenwood township, St. Clair County, MI
- Ira township, St. Clair County, MI
- Kenockee township, St. Clair County, MI
- Kimball township, St. Clair County, MI
- Lynn township, St. Clair County, MI
- Marine City city, St. Clair County, MI
- Marysville city, St. Clair County, MI
- Memphis city, St. Clair County, MI
- Mussey township, St. Clair County, MI
- Port Huron charter township, St. Clair County, MI
- Port Huron city, St. Clair County, MI
- Richmond city, St. Clair County, MI
- Riley township, St. Clair County, MI
- St. Clair township, St. Clair County, MI
- St. Clair city, St. Clair County, MI
- Wales township, St. Clair County, MI
- Yale city, St. Clair County, MI
Top 10 Neighboring Place (by Population) Neighboring Place on the Map
- Port Huron city, MI (30,184)
- New Baltimore city, MI (12,084)
- Marysville city, MI (9,959)
- Richmond city, MI (5,735)
- St. Clair city, MI (5,485)
- Marine City city, MI (4,248)
- Algonac city, MI (4,110)
- Pearl Beach CDP, MI (2,829)
- Yale city, MI (1,955)
- Capac village, MI (1,890)
Top 10 Neighboring Unified School District (by Population) Neighboring Unified School District on the Map
- Port Huron Area School District, MI (68,694)
- Anchor Bay School District, MI (34,890)
- East China School District, MI (29,381)
- Algonac Community School District, MI (15,197)
- New Haven Community Schools, MI (14,646)
- Croswell-Lexington Community School District, MI (14,438)
- Marysville Public Schools, MI (13,916)
- Richmond Community Schools, MI (12,514)
- Imlay City Community Schools, MI (12,127)
- Yale Public Schools, MI (11,279)
Top 10 Neighboring State Legislative District Lower Chamber (by Population) Neighboring State Legislative District Lower Chamber on the Map
- State House District 36, MI (107,643)
- State House District 32, MI (103,394)
- State House District 81, MI (95,883)
- State House District 83, MI (88,414)
- State House District 82, MI (88,319)
- State House District 24, MI (84,381)
Top 10 Neighboring State Legislative District Upper Chamber (by Population) Neighboring State Legislative District Upper Chamber on the Map
- State Senate District 11, MI (313,398)
- State Senate District 31, MI (255,631)
- State Senate District 25, MI (251,359)
- State Senate District 9, MI (249,029)
Top 10 Neighboring 111th Congressional District (by Population) Neighboring 111th Congressional District on the Map
Top 10 Census Tract in St. Clair County (by Population) Neighboring Census Tract on the Map
- Census Tract 6350, St. Clair County, MI (6,177)
- Census Tract 6304, St. Clair County, MI (5,805)
- Census Tract 6572, St. Clair County, MI (5,601)
- Census Tract 6346, St. Clair County, MI (5,554)
- Census Tract 6420, St. Clair County, MI (5,482)
- Census Tract 6551, St. Clair County, MI (5,212)
- Census Tract 6460, St. Clair County, MI (4,768)
- Census Tract 6200, St. Clair County, MI (4,698)
- Census Tract 6360, St. Clair County, MI (4,477)
- Census Tract 6440, St. Clair County, MI (4,381)
Top 10 Neighboring 5-Digit ZIP Code Tabulation Area (by Population) Neighboring 5-Digit ZIP Code Tabulation Area on the Map
- 48060, MI (40,831)
- 48047, MI (39,415)
- 48059, MI (15,123)
- 48079, MI (12,304)
- 48001, MI (11,986)
- 48065, MI (10,547)
- 48040, MI (9,956)
- 48062, MI (9,373)
- 48074, MI (9,356)
- 48444, MI (9,327)
Data
Demographic, Population, Households, and Housing Units
** Data sources from census 2010 **
Show Data on Map
Download Full List as CSV
Download Quick Sheet as CSV
| Subject | This Area | Michigan | National |
|---|---|---|---|
| POPULATION | |||
| Total Population Map | 163,040 | 9,883,640 | 308,745,538 |
| POPULATION, HISPANIC OR LATINO ORIGIN | |||
| Not Hispanic or Latino Map | 158,332 | 9,447,282 | 258,267,944 |
| Hispanic or Latino Map | 4,708 | 436,358 | 50,477,594 |
| POPULATION, RACE | |||
| White alone Map | 153,052 | 7,803,120 | 223,553,265 |
| Black or African American alone Map | 3,976 | 1,400,362 | 38,929,319 |
| American Indian and Alaska Native alone Map | 729 | 62,007 | 2,932,248 |
| Asian alone Map | 777 | 238,199 | 14,674,252 |
| Native Hawaiian and Other Pacific Islander alone Map | 29 | 2,604 | 540,013 |
| Some Other Race alone Map | 1,177 | 147,029 | 19,107,368 |
| Two or More Races Map | 3,300 | 230,319 | 9,009,073 |
| POPULATION, SEX | |||
| Male Map | 80,724 | 4,848,114 | 151,781,326 |
| Female Map | 82,316 | 5,035,526 | 156,964,212 |
| POPULATION, AGE (18 YEARS) | |||
| 18 years and over Map | 124,427 | 7,539,572 | 234,564,071 |
| Under 18 years | 38,613 | 2,344,068 | 74,181,467 |
| POPULATION, AGE | |||
| Under 5 years | 9,288 | 596,286 | 20,201,362 |
| 5 to 9 years | 10,402 | 637,784 | 20,348,657 |
| 10 to 14 years | 11,424 | 675,216 | 20,677,194 |
| 15 to 17 years | 7,499 | 434,782 | 12,954,254 |
| 18 and 19 years | 4,263 | 304,817 | 9,086,089 |
| 20 years | 1,944 | 149,350 | 4,519,129 |
| 21 years | 1,674 | 138,484 | 4,354,294 |
| 22 to 24 years | 5,096 | 381,238 | 12,712,576 |
| 25 to 29 years | 8,237 | 589,583 | 21,101,849 |
| 30 to 34 years | 8,570 | 574,566 | 19,962,099 |
| 35 to 39 years | 10,046 | 612,493 | 20,179,642 |
| 40 to 44 years | 11,894 | 665,481 | 20,890,964 |
| 45 to 49 years | 13,596 | 744,581 | 22,708,591 |
| 50 to 54 years | 13,450 | 765,452 | 22,298,125 |
| 55 to 59 years | 11,916 | 683,186 | 19,664,805 |
| 60 and 61 years | 4,367 | 243,067 | 7,113,727 |
| 62 to 64 years | 5,703 | 325,744 | 9,704,197 |
| 65 and 66 years | 3,139 | 177,313 | 5,319,902 |
| 67 to 69 years | 4,422 | 241,312 | 7,115,361 |
| 70 to 74 years | 5,333 | 306,084 | 9,278,166 |
| 75 to 79 years | 4,182 | 244,085 | 7,317,795 |
| 80 to 84 years | 3,383 | 200,855 | 5,743,327 |
| 85 years and over | 3,212 | 191,881 | 5,493,433 |
| MEDIAN AGE BY SEX | |||
| Both sexes Map | 41.30 | 38.90 | 37.20 |
| Male Map | 40.40 | 37.60 | 35.80 |
| Female Map | 42.20 | 40.00 | 38.50 |
| HOUSEHOLDS | |||
| Total Households Map | 63,841 | 3,872,508 | 116,716,292 |
| HOUSEHOLDS, HOUSEHOLD TYPE | |||
| Family households: Map | 44,238 | 2,554,073 | 77,538,296 |
| Husband-wife family Map | 33,795 | 1,857,127 | 56,510,377 |
| Other family: Map | 10,443 | 696,946 | 21,027,919 |
| Male householder, no wife present Map | 3,177 | 185,363 | 5,777,570 |
| Female householder, no husband present Map | 7,266 | 511,583 | 15,250,349 |
| Nonfamily households: Map | 19,603 | 1,318,435 | 39,177,996 |
| Householder living alone Map | 16,279 | 1,079,678 | 31,204,909 |
| Householder not living alone Map | 3,324 | 238,757 | 7,973,087 |
| HOUSEHOLDS, HISPANIC OR LATINO ORIGIN OF HOUSEHOLDER | |||
| Not Hispanic or Latino householder: Map | 62,618 | 3,757,825 | 103,254,926 |
| Hispanic or Latino householder: Map | 1,223 | 114,683 | 13,461,366 |
| HOUSEHOLDS, RACE OF HOUSEHOLDER | |||
| Householder who is White alone | 60,966 | 3,158,462 | 89,754,352 |
| Householder who is Black or African American alone | 1,404 | 523,980 | 14,129,983 |
| Householder who is American Indian and Alaska Native alone | 292 | 22,676 | 939,707 |
| Householder who is Asian alone | 207 | 74,263 | 4,632,164 |
| Householder who is Native Hawaiian and Other Pacific Islander alone | 9 | 860 | 143,932 |
| Householder who is Some Other Race alone | 364 | 39,917 | 4,916,427 |
| Householder who is Two or More Races | 599 | 52,350 | 2,199,727 |
| HOUSEHOLDS, HOUSEHOLD TYPE BY HOUSEHOLD SIZE | |||
| Family households: Map | 44,238 | 2,554,073 | 77,538,296 |
| 2-person household Map | 19,684 | 1,116,122 | 31,882,616 |
| 3-person household Map | 9,994 | 575,906 | 17,765,829 |
| 4-person household Map | 8,452 | 490,745 | 15,214,075 |
| 5-person household Map | 3,874 | 230,373 | 7,411,997 |
| 6-person household Map | 1,455 | 87,344 | 3,026,278 |
| 7-or-more-person household Map | 779 | 53,583 | 2,237,501 |
| Nonfamily households: Map | 19,603 | 1,318,435 | 39,177,996 |
| 1-person household Map | 16,279 | 1,079,678 | 31,204,909 |
| 2-person household Map | 2,784 | 191,327 | 6,360,012 |
| 3-person household Map | 346 | 27,576 | 992,156 |
| 4-person household Map | 119 | 13,570 | 411,171 |
| 5-person household Map | 44 | 3,701 | 126,634 |
| 6-person household Map | 20 | 1,628 | 48,421 |
| 7-or-more-person household Map | 11 | 955 | 34,693 |
| HOUSING UNITS | |||
| Total Housing Units Map | 71,822 | 4,532,233 | 131,704,730 |
| HOUSING UNITS, OCCUPANCY STATUS | |||
| Occupied Map | 63,841 | 3,872,508 | 116,716,292 |
| Vacant Map | 7,981 | 659,725 | 14,988,438 |
| HOUSING UNITS, OCCUPIED, TENURE | |||
| Owned with a mortgage or a loan Map | 34,484 | 1,920,245 | 52,979,430 |
| Owned free and clear Map | 14,872 | 873,097 | 23,006,644 |
| Renter occupied Map | 14,485 | 1,079,166 | 40,730,218 |
| HOUSING UNITS, VACANT, VACANCY STATUS | |||
| For rent Map | 1,913 | 141,687 | 4,137,567 |
| Rented, not occupied Map | 70 | 6,684 | 206,825 |
| For sale only Map | 1,196 | 77,080 | 1,896,796 |
| Sold, not occupied Map | 335 | 17,978 | 421,032 |
| For seasonal, recreational, or occasional use Map | 2,509 | 263,071 | 4,649,298 |
| For migrant workers Map | 5 | 1,773 | 24,161 |
| Other vacant Map | 1,953 | 151,452 | 3,652,759 |
| HOUSING UNITS, OCCUPIED, AVERAGE HOUSEHOLD SIZE BY TENURE | |||
| Total: Map | 2.52 | 2.49 | 2.58 |
| Owner occupied Map | 2.58 | 2.57 | 2.65 |
| Renter occupied Map | 2.32 | 2.29 | 2.44 |
| HOUSING UNITS, OCCUPIED, TENURE BY RACE OF HOUSEHOLDER | |||
| Owner occupied: Map | 49,356 | 2,793,342 | 75,986,074 |
| Householder who is White alone Map | 47,940 | 2,452,233 | 63,446,275 |
| Householder who is Black or African American alone Map | 558 | 235,381 | 6,261,464 |
| Householder who is American Indian and Alaska Native alone Map | 167 | 13,611 | 509,588 |
| Householder who is Asian alone Map | 151 | 43,419 | 2,688,861 |
| Householder who is Native Hawaiian and Other Pacific Islander alone Map | 7 | 466 | 61,911 |
| Householder who is Some Other Race alone Map | 209 | 20,361 | 1,975,817 |
| Householder who is Two or More Races Map | 324 | 27,871 | 1,042,158 |
| Renter occupied: Map | 14,485 | 1,079,166 | 40,730,218 |
| Householder who is White alone Map | 13,026 | 706,229 | 26,308,077 |
| Householder who is Black or African American alone Map | 846 | 288,599 | 7,868,519 |
| Householder who is American Indian and Alaska Native alone Map | 125 | 9,065 | 430,119 |
| Householder who is Asian alone Map | 56 | 30,844 | 1,943,303 |
| Householder who is Native Hawaiian and Other Pacific Islander alone Map | 2 | 394 | 82,021 |
| Householder who is Some Other Race alone Map | 155 | 19,556 | 2,940,610 |
| Householder who is Two or More Races Map | 275 | 24,479 | 1,157,569 |
| HOUSING UNITS, OCCUPIED, TENURE BY HISPANIC OR LATINO ORIGIN OF HOUSEHOLDER | |||
| Owner occupied: Map | 49,356 | 2,793,342 | 75,986,074 |
| Not Hispanic or Latino householder Map | 48,616 | 2,728,916 | 69,617,625 |
| Hispanic or Latino householder Map | 740 | 64,426 | 6,368,449 |
| Renter occupied: Map | 14,485 | 1,079,166 | 40,730,218 |
| Not Hispanic or Latino householder Map | 14,002 | 1,028,909 | 33,637,301 |
| Hispanic or Latino householder Map | 483 | 50,257 | 7,092,917 |
| HOUSING UNITS, OCCUPIED, TENURE BY HOUSEHOLD SIZE | |||
| Owner occupied: Map | 49,356 | 2,793,342 | 75,986,074 |
| 1-person household Map | 10,539 | 643,556 | 16,453,569 |
| 2-person household Map | 18,884 | 1,031,004 | 27,618,605 |
| 3-person household Map | 8,119 | 446,449 | 12,517,563 |
| 4-person household Map | 7,032 | 392,843 | 10,998,793 |
| 5-person household Map | 3,066 | 177,918 | 5,057,765 |
| 6-person household Map | 1,132 | 64,470 | 1,965,796 |
| 7-or-more-person household Map | 584 | 37,102 | 1,373,983 |
| Renter occupied: Map | 14,485 | 1,079,166 | 40,730,218 |
| 1-person household Map | 5,740 | 436,122 | 14,751,340 |
| 2-person household Map | 3,584 | 276,445 | 10,624,023 |
| 3-person household Map | 2,221 | 157,033 | 6,240,422 |
| 4-person household Map | 1,539 | 111,472 | 4,626,453 |
| 5-person household Map | 852 | 56,156 | 2,480,866 |
| 6-person household Map | 343 | 24,502 | 1,108,903 |
| 7-or-more-person household Map | 206 | 17,436 | 898,211 |
Loading...