


Hancock County, Illinois
About
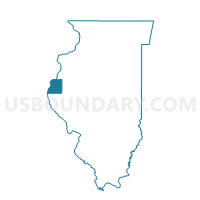
Outline

Summary
| Unique Area Identifier | 120194 |
| Name | Hancock County |
| State | Illinois |
| Area (square miles) | 814.40 |
| Land Area (square miles) | 793.73 |
| Water Area (square miles) | 20.67 |
| % of Land Area | 97.46 |
| % of Water Area | 2.54 |
| Latitude of the Internal Point | 40.40579240 |
| Longtitude of the Internal Point | -91.16798750 |
| Total Population | 19,104 |
| Total Housing Units | 9,274 |
| Total Households | 8,040 |
| Median Age | 44.6 |
Maps
Graphs
Select a template below for downloading or customizing gragh for Hancock County, Illinois


Neighbors
Neighoring County (by Name) Neighboring County on the Map
- Adams County, IL
- Clark County, MO
- Henderson County, IL
- Lee County, IA
- Lewis County, MO
- McDonough County, IL
- Schuyler County, IL
County Subdivision in Hancock County (by Name) Neighboring County Subdivision on the Map
- Appanoose township, Hancock County, IL
- Augusta township, Hancock County, IL
- Bear Creek township, Hancock County, IL
- Carthage township, Hancock County, IL
- Chili township, Hancock County, IL
- Dallas City township, Hancock County, IL
- Durham township, Hancock County, IL
- Fountain Green township, Hancock County, IL
- Hancock township, Hancock County, IL
- Harmony township, Hancock County, IL
- La Harpe township, Hancock County, IL
- Montebello township, Hancock County, IL
- Nauvoo township, Hancock County, IL
- Pilot Grove township, Hancock County, IL
- Pontoosuc township, Hancock County, IL
- Prairie township, Hancock County, IL
- Rock Creek township, Hancock County, IL
- Rocky Run township, Hancock County, IL
- Sonora township, Hancock County, IL
- St. Albans township, Hancock County, IL
- St. Mary township, Hancock County, IL
- Walker township, Hancock County, IL
- Warsaw township, Hancock County, IL
- Wilcox township, Hancock County, IL
- Wythe township, Hancock County, IL
Top 10 Neighboring Place (by Population) Neighboring Place on the Map
- Fort Madison city, IA (11,051)
- Keokuk city, IA (10,780)
- Hamilton city, IL (2,951)
- Carthage city, IL (2,605)
- Warsaw city, IL (1,607)
- La Harpe city, IL (1,235)
- Nauvoo city, IL (1,149)
- Dallas City city, IL (945)
- Augusta village, IL (587)
- Plymouth village, IL (505)
Top 10 Neighboring Elementary School District (by Population) Neighboring Elementary School District on the Map
- Carthage Elementary School District 317, IL (4,250)
- La Harpe Community School District 347, IL (2,207)
- Dallas Elementary School District 327, IL (2,073)
Top 10 Neighboring Secondary School District (by Population) Neighboring Secondary School District on the Map
Top 10 Neighboring Unified School District (by Population) Neighboring Unified School District on the Map
- Fort Madison Community School District, IA (17,311)
- Keokuk Community School District, IA (12,959)
- West Central Community Unit School District 235, IL (6,207)
- Clark County R-I School District, MO (6,053)
- Central Lee Community School District, IA (5,363)
- Camp Point Community Unit School District 3, IL (5,029)
- West Prairie Community Unit School District 103, IL (4,858)
- Community Unit School District 4, IL (4,314)
- Hamilton Community Consolidated School District 328, IL (4,038)
- Canton School District, MO (4,008)
Top 10 Neighboring State Legislative District Lower Chamber (by Population) Neighboring State Legislative District Lower Chamber on the Map
- State House District 93, IL (103,943)
- State House District 94, IL (100,005)
- State House District 1, MO (33,818)
- State House District 92, IA (28,301)
- State House District 91, IA (27,706)
Top 10 Neighboring State Legislative District Upper Chamber (by Population) Neighboring State Legislative District Upper Chamber on the Map
- State Senate District 47, IL (203,948)
- State Senate District 18, MO (159,547)
- State Senate District 46, IA (56,007)
Top 10 Neighboring 111th Congressional District (by Population) Neighboring 111th Congressional District on the Map
- Congressional District 9, MO (684,101)
- Congressional District 18, IL (665,723)
- Congressional District 17, IL (634,792)
- Congressional District 2, IA (620,856)
Top 10 Census Tract in Hancock County (by Population) Neighboring Census Tract on the Map
- Census Tract 9543, Hancock County, IL (3,721)
- Census Tract 9541, Hancock County, IL (3,398)
- Census Tract 9538, Hancock County, IL (2,720)
- Census Tract 9540, Hancock County, IL (2,544)
- Census Tract 9542, Hancock County, IL (2,460)
- Census Tract 9537, Hancock County, IL (2,268)
- Census Tract 9539, Hancock County, IL (1,993)
Top 10 Neighboring 5-Digit ZIP Code Tabulation Area (by Population) Neighboring 5-Digit ZIP Code Tabulation Area on the Map
- 52627, IA (13,105)
- 52632, IA (13,086)
- 63435, MO (4,219)
- 62321, IL (4,091)
- 62341, IL (3,610)
- 62326, IL (2,478)
- 62379, IL (2,049)
- 52639, IA (2,002)
- 62351, IL (1,856)
- 62330, IL (1,769)
Data
Demographic, Population, Households, and Housing Units
** Data sources from census 2010 **
Show Data on Map
Download Full List as CSV
Download Quick Sheet as CSV
| Subject | This Area | Illinois | National |
|---|---|---|---|
| POPULATION | |||
| Total Population Map | 19,104 | 12,830,632 | 308,745,538 |
| POPULATION, HISPANIC OR LATINO ORIGIN | |||
| Not Hispanic or Latino Map | 18,919 | 10,803,054 | 258,267,944 |
| Hispanic or Latino Map | 185 | 2,027,578 | 50,477,594 |
| POPULATION, RACE | |||
| White alone Map | 18,723 | 9,177,877 | 223,553,265 |
| Black or African American alone Map | 52 | 1,866,414 | 38,929,319 |
| American Indian and Alaska Native alone Map | 40 | 43,963 | 2,932,248 |
| Asian alone Map | 46 | 586,934 | 14,674,252 |
| Native Hawaiian and Other Pacific Islander alone Map | 11 | 4,050 | 540,013 |
| Some Other Race alone Map | 56 | 861,412 | 19,107,368 |
| Two or More Races Map | 176 | 289,982 | 9,009,073 |
| POPULATION, SEX | |||
| Male Map | 9,390 | 6,292,276 | 151,781,326 |
| Female Map | 9,714 | 6,538,356 | 156,964,212 |
| POPULATION, AGE (18 YEARS) | |||
| 18 years and over Map | 14,907 | 9,701,453 | 234,564,071 |
| Under 18 years | 4,197 | 3,129,179 | 74,181,467 |
| POPULATION, AGE | |||
| Under 5 years | 1,119 | 835,577 | 20,201,362 |
| 5 to 9 years | 1,118 | 859,405 | 20,348,657 |
| 10 to 14 years | 1,179 | 879,448 | 20,677,194 |
| 15 to 17 years | 781 | 554,749 | 12,954,254 |
| 18 and 19 years | 467 | 367,343 | 9,086,089 |
| 20 years | 172 | 179,613 | 4,519,129 |
| 21 years | 162 | 172,795 | 4,354,294 |
| 22 to 24 years | 538 | 526,556 | 12,712,576 |
| 25 to 29 years | 995 | 910,273 | 21,101,849 |
| 30 to 34 years | 1,000 | 865,684 | 19,962,099 |
| 35 to 39 years | 986 | 855,790 | 20,179,642 |
| 40 to 44 years | 1,142 | 870,100 | 20,890,964 |
| 45 to 49 years | 1,376 | 940,094 | 22,708,591 |
| 50 to 54 years | 1,511 | 930,785 | 22,298,125 |
| 55 to 59 years | 1,444 | 807,778 | 19,664,805 |
| 60 and 61 years | 565 | 284,180 | 7,113,727 |
| 62 to 64 years | 763 | 381,249 | 9,704,197 |
| 65 and 66 years | 439 | 205,270 | 5,319,902 |
| 67 to 69 years | 638 | 279,790 | 7,115,361 |
| 70 to 74 years | 898 | 364,475 | 9,278,166 |
| 75 to 79 years | 716 | 289,385 | 7,317,795 |
| 80 to 84 years | 556 | 235,381 | 5,743,327 |
| 85 years and over | 539 | 234,912 | 5,493,433 |
| MEDIAN AGE BY SEX | |||
| Both sexes Map | 44.60 | 36.60 | 37.20 |
| Male Map | 43.00 | 35.20 | 35.80 |
| Female Map | 46.10 | 37.90 | 38.50 |
| HOUSEHOLDS | |||
| Total Households Map | 8,040 | 4,836,972 | 116,716,292 |
| HOUSEHOLDS, HOUSEHOLD TYPE | |||
| Family households: Map | 5,427 | 3,182,984 | 77,538,296 |
| Husband-wife family Map | 4,443 | 2,332,995 | 56,510,377 |
| Other family: Map | 984 | 849,989 | 21,027,919 |
| Male householder, no wife present Map | 314 | 227,684 | 5,777,570 |
| Female householder, no husband present Map | 670 | 622,305 | 15,250,349 |
| Nonfamily households: Map | 2,613 | 1,653,988 | 39,177,996 |
| Householder living alone Map | 2,269 | 1,346,312 | 31,204,909 |
| Householder not living alone Map | 344 | 307,676 | 7,973,087 |
| HOUSEHOLDS, HISPANIC OR LATINO ORIGIN OF HOUSEHOLDER | |||
| Not Hispanic or Latino householder: Map | 7,997 | 4,329,737 | 103,254,926 |
| Hispanic or Latino householder: Map | 43 | 507,235 | 13,461,366 |
| HOUSEHOLDS, RACE OF HOUSEHOLDER | |||
| Householder who is White alone | 7,945 | 3,680,912 | 89,754,352 |
| Householder who is Black or African American alone | 10 | 668,152 | 14,129,983 |
| Householder who is American Indian and Alaska Native alone | 10 | 13,449 | 939,707 |
| Householder who is Asian alone | 13 | 192,603 | 4,632,164 |
| Householder who is Native Hawaiian and Other Pacific Islander alone | 8 | 1,278 | 143,932 |
| Householder who is Some Other Race alone | 15 | 213,509 | 4,916,427 |
| Householder who is Two or More Races | 39 | 67,069 | 2,199,727 |
| HOUSEHOLDS, HOUSEHOLD TYPE BY HOUSEHOLD SIZE | |||
| Family households: Map | 5,427 | 3,182,984 | 77,538,296 |
| 2-person household Map | 2,921 | 1,259,669 | 31,882,616 |
| 3-person household Map | 1,046 | 720,213 | 17,765,829 |
| 4-person household Map | 823 | 644,972 | 15,214,075 |
| 5-person household Map | 402 | 326,688 | 7,411,997 |
| 6-person household Map | 154 | 132,759 | 3,026,278 |
| 7-or-more-person household Map | 81 | 98,683 | 2,237,501 |
| Nonfamily households: Map | 2,613 | 1,653,988 | 39,177,996 |
| 1-person household Map | 2,269 | 1,346,312 | 31,204,909 |
| 2-person household Map | 288 | 250,239 | 6,360,012 |
| 3-person household Map | 34 | 36,254 | 992,156 |
| 4-person household Map | 14 | 14,759 | 411,171 |
| 5-person household Map | 4 | 3,959 | 126,634 |
| 6-person household Map | 3 | 1,433 | 48,421 |
| 7-or-more-person household Map | 1 | 1,032 | 34,693 |
| HOUSING UNITS | |||
| Total Housing Units Map | 9,274 | 5,296,715 | 131,704,730 |
| HOUSING UNITS, OCCUPANCY STATUS | |||
| Occupied Map | 8,040 | 4,836,972 | 116,716,292 |
| Vacant Map | 1,234 | 459,743 | 14,988,438 |
| HOUSING UNITS, OCCUPIED, TENURE | |||
| Owned with a mortgage or a loan Map | 3,263 | 2,338,493 | 52,979,430 |
| Owned free and clear Map | 3,075 | 925,146 | 23,006,644 |
| Renter occupied Map | 1,702 | 1,573,333 | 40,730,218 |
| HOUSING UNITS, VACANT, VACANCY STATUS | |||
| For rent Map | 252 | 158,882 | 4,137,567 |
| Rented, not occupied Map | 45 | 7,998 | 206,825 |
| For sale only Map | 140 | 82,739 | 1,896,796 |
| Sold, not occupied Map | 56 | 16,677 | 421,032 |
| For seasonal, recreational, or occasional use Map | 288 | 47,289 | 4,649,298 |
| For migrant workers Map | 1 | 315 | 24,161 |
| Other vacant Map | 452 | 145,843 | 3,652,759 |
| HOUSING UNITS, OCCUPIED, AVERAGE HOUSEHOLD SIZE BY TENURE | |||
| Total: Map | 2.35 | 2.59 | 2.58 |
| Owner occupied Map | 2.40 | 2.69 | 2.65 |
| Renter occupied Map | 2.14 | 2.38 | 2.44 |
| HOUSING UNITS, OCCUPIED, TENURE BY RACE OF HOUSEHOLDER | |||
| Owner occupied: Map | 6,338 | 3,263,639 | 75,986,074 |
| Householder who is White alone Map | 6,295 | 2,728,000 | 63,446,275 |
| Householder who is Black or African American alone Map | 3 | 272,489 | 6,261,464 |
| Householder who is American Indian and Alaska Native alone Map | 5 | 6,873 | 509,588 |
| Householder who is Asian alone Map | 8 | 118,649 | 2,688,861 |
| Householder who is Native Hawaiian and Other Pacific Islander alone Map | 4 | 644 | 61,911 |
| Householder who is Some Other Race alone Map | 2 | 103,641 | 1,975,817 |
| Householder who is Two or More Races Map | 21 | 33,343 | 1,042,158 |
| Renter occupied: Map | 1,702 | 1,573,333 | 40,730,218 |
| Householder who is White alone Map | 1,650 | 952,912 | 26,308,077 |
| Householder who is Black or African American alone Map | 7 | 395,663 | 7,868,519 |
| Householder who is American Indian and Alaska Native alone Map | 5 | 6,576 | 430,119 |
| Householder who is Asian alone Map | 5 | 73,954 | 1,943,303 |
| Householder who is Native Hawaiian and Other Pacific Islander alone Map | 4 | 634 | 82,021 |
| Householder who is Some Other Race alone Map | 13 | 109,868 | 2,940,610 |
| Householder who is Two or More Races Map | 18 | 33,726 | 1,157,569 |
| HOUSING UNITS, OCCUPIED, TENURE BY HISPANIC OR LATINO ORIGIN OF HOUSEHOLDER | |||
| Owner occupied: Map | 6,338 | 3,263,639 | 75,986,074 |
| Not Hispanic or Latino householder Map | 6,323 | 2,996,581 | 69,617,625 |
| Hispanic or Latino householder Map | 15 | 267,058 | 6,368,449 |
| Renter occupied: Map | 1,702 | 1,573,333 | 40,730,218 |
| Not Hispanic or Latino householder Map | 1,674 | 1,333,156 | 33,637,301 |
| Hispanic or Latino householder Map | 28 | 240,177 | 7,092,917 |
| HOUSING UNITS, OCCUPIED, TENURE BY HOUSEHOLD SIZE | |||
| Owner occupied: Map | 6,338 | 3,263,639 | 75,986,074 |
| 1-person household Map | 1,551 | 732,688 | 16,453,569 |
| 2-person household Map | 2,691 | 1,111,442 | 27,618,605 |
| 3-person household Map | 895 | 529,763 | 12,517,563 |
| 4-person household Map | 679 | 493,300 | 10,998,793 |
| 5-person household Map | 335 | 238,851 | 5,057,765 |
| 6-person household Map | 128 | 92,193 | 1,965,796 |
| 7-or-more-person household Map | 59 | 65,402 | 1,373,983 |
| Renter occupied: Map | 1,702 | 1,573,333 | 40,730,218 |
| 1-person household Map | 718 | 613,624 | 14,751,340 |
| 2-person household Map | 518 | 398,466 | 10,624,023 |
| 3-person household Map | 185 | 226,704 | 6,240,422 |
| 4-person household Map | 158 | 166,431 | 4,626,453 |
| 5-person household Map | 71 | 91,796 | 2,480,866 |
| 6-person household Map | 29 | 41,999 | 1,108,903 |
| 7-or-more-person household Map | 23 | 34,313 | 898,211 |
Loading...