


Litchfield County, Connecticut
About
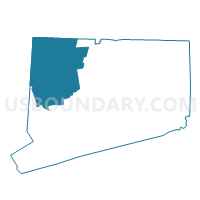
Outline

Summary
| Unique Area Identifier | 121222 |
| Name | Litchfield County |
| State | Connecticut |
| Area (square miles) | 944.56 |
| Land Area (square miles) | 920.56 |
| Water Area (square miles) | 24.00 |
| % of Land Area | 97.46 |
| % of Water Area | 2.54 |
| Latitude of the Internal Point | 41.79189670 |
| Longtitude of the Internal Point | -73.23542790 |
| Total Population | 189,927 |
| Total Housing Units | 87,550 |
| Total Households | 76,640 |
| Median Age | 44.4 |
Maps
Graphs
Select a template below for downloading or customizing gragh for Litchfield County, Connecticut


Neighbors
Neighoring County (by Name) Neighboring County on the Map
- Berkshire County, MA
- Dutchess County, NY
- Fairfield County, CT
- Hampden County, MA
- Hartford County, CT
- New Haven County, CT
County Subdivision in Litchfield County (by Name) Neighboring County Subdivision on the Map
- Barkhamsted town, Litchfield County, CT
- Bethlehem town, Litchfield County, CT
- Bridgewater town, Litchfield County, CT
- Canaan town, Litchfield County, CT
- Colebrook town, Litchfield County, CT
- Cornwall town, Litchfield County, CT
- Goshen town, Litchfield County, CT
- Harwinton town, Litchfield County, CT
- Kent town, Litchfield County, CT
- Litchfield town, Litchfield County, CT
- Morris town, Litchfield County, CT
- New Hartford town, Litchfield County, CT
- New Milford town, Litchfield County, CT
- Norfolk town, Litchfield County, CT
- North Canaan town, Litchfield County, CT
- Plymouth town, Litchfield County, CT
- Roxbury town, Litchfield County, CT
- Salisbury town, Litchfield County, CT
- Sharon town, Litchfield County, CT
- Thomaston town, Litchfield County, CT
- Torrington town, Litchfield County, CT
- Warren town, Litchfield County, CT
- Washington town, Litchfield County, CT
- Watertown town, Litchfield County, CT
- Winchester town, Litchfield County, CT
- Woodbury town, Litchfield County, CT
Top 10 Neighboring Place (by Population) Neighboring Place on the Map
- Waterbury city, CT (110,366)
- Bristol city, CT (60,477)
- Torrington city, CT (36,383)
- Oakville CDP, CT (9,047)
- Winsted CDP, CT (7,712)
- New Milford CDP, CT (6,523)
- Terryville CDP, CT (5,387)
- Collinsville CDP, CT (3,746)
- Watertown CDP, CT (3,574)
- Northwest Harwinton CDP, CT (3,252)
Top 10 Neighboring Elementary School District (by Population) Neighboring Elementary School District on the Map
- New Hartford School District, CT (6,970)
- Barkhamsted School District, CT (3,799)
- Salisbury School District, CT (3,741)
- Sherman School District, CT (3,581)
- North Canaan School District, CT (3,315)
- Kent School District, CT (2,979)
- Sharon School District, CT (2,782)
- Farmington River Regional School District, MA (2,527)
- Hartland School District, CT (2,114)
- Norfolk School District, CT (1,709)
Top 10 Neighboring Secondary School District (by Population) Neighboring Secondary School District on the Map
- Regional High School District 01, CT (15,471)
- Regional High School District 07, CT (13,963)
- Lee/Berkshire Hills in Farmington River Regional (7-12), MA (2,527)
Top 10 Neighboring Unified School District (by Population) Neighboring Unified School District on the Map
- Waterbury School District, CT (110,366)
- Bristol School District, CT (60,477)
- Torrington School District, CT (36,383)
- New Milford School District, CT (28,142)
- Newtown School District, CT (27,560)
- Regional School District 15, CT (27,479)
- Watertown School District, CT (22,514)
- Wolcott School District, CT (16,680)
- Brookfield School District, CT (16,452)
- Regional School District 10, CT (14,943)
Top 10 Neighboring State Legislative District Lower Chamber (by Population) Neighboring State Legislative District Lower Chamber on the Map
- Assembly District 103, NY (134,686)
- Fourth Berkshire District, MA (37,775)
- State House District 17, CT (25,082)
- State House District 71, CT (24,975)
- State House District 76, CT (24,317)
- State House District 80, CT (24,200)
- State House District 78, CT (24,163)
- State House District 106, CT (24,049)
- State House District 79, CT (23,980)
- State House District 62, CT (23,806)
Top 10 Neighboring State Legislative District Upper Chamber (by Population) Neighboring State Legislative District Upper Chamber on the Map
- State Senate District 40, NY (316,324)
- Second Hampden & Hampshire District, MA (156,603)
- Berkshire, Hampshire & Franklin District, MA (149,418)
- State Senate District 16, CT (105,218)
- State Senate District 24, CT (104,062)
- State Senate District 28, CT (103,194)
- State Senate District 30, CT (102,325)
- State Senate District 32, CT (101,305)
- State Senate District 5, CT (98,818)
- State Senate District 8, CT (98,790)
Top 10 Neighboring 111th Congressional District (by Population) Neighboring 111th Congressional District on the Map
- Congressional District 5, CT (714,296)
- Congressional District 1, CT (710,951)
- Congressional District 19, NY (699,959)
- Congressional District 20, NY (683,198)
- Congressional District 1, MA (644,956)
Top 10 Census Tract in Litchfield County (by Population) Neighboring Census Tract on the Map
- Census Tract 3602, Litchfield County, CT (7,765)
- Census Tract 2532, Litchfield County, CT (7,429)
- Census Tract 3061, Litchfield County, CT (6,970)
- Census Tract 3201, Litchfield County, CT (6,345)
- Census Tract 2534, Litchfield County, CT (6,308)
- Census Tract 2535, Litchfield County, CT (6,114)
- Census Tract 3604, Litchfield County, CT (5,996)
- Census Tract 3621.02, Litchfield County, CT (5,816)
- Census Tract 3601, Litchfield County, CT (5,357)
- Census Tract 3491, Litchfield County, CT (5,045)
Top 10 Neighboring 5-Digit ZIP Code Tabulation Area (by Population) Neighboring 5-Digit ZIP Code Tabulation Area on the Map
- 06010, CT (60,448)
- 06790, CT (36,482)
- 06708, CT (29,418)
- 06776, CT (26,889)
- 06704, CT (25,139)
- 06488, CT (19,904)
- 06716, CT (16,680)
- 06804, CT (16,466)
- 06470, CT (16,003)
- 06795, CT (14,144)
Data
Demographic, Population, Households, and Housing Units
** Data sources from census 2010 **
Show Data on Map
Download Full List as CSV
Download Quick Sheet as CSV
| Subject | This Area | Connecticut | National |
|---|---|---|---|
| POPULATION | |||
| Total Population Map | 189,927 | 3,574,097 | 308,745,538 |
| POPULATION, HISPANIC OR LATINO ORIGIN | |||
| Not Hispanic or Latino Map | 181,392 | 3,095,010 | 258,267,944 |
| Hispanic or Latino Map | 8,535 | 479,087 | 50,477,594 |
| POPULATION, RACE | |||
| White alone Map | 178,268 | 2,772,410 | 223,553,265 |
| Black or African American alone Map | 2,558 | 362,296 | 38,929,319 |
| American Indian and Alaska Native alone Map | 404 | 11,256 | 2,932,248 |
| Asian alone Map | 2,908 | 135,565 | 14,674,252 |
| Native Hawaiian and Other Pacific Islander alone Map | 45 | 1,428 | 540,013 |
| Some Other Race alone Map | 2,708 | 198,466 | 19,107,368 |
| Two or More Races Map | 3,036 | 92,676 | 9,009,073 |
| POPULATION, SEX | |||
| Male Map | 93,338 | 1,739,614 | 151,781,326 |
| Female Map | 96,589 | 1,834,483 | 156,964,212 |
| POPULATION, AGE (18 YEARS) | |||
| 18 years and over Map | 148,975 | 2,757,082 | 234,564,071 |
| Under 18 years | 40,952 | 817,015 | 74,181,467 |
| POPULATION, AGE | |||
| Under 5 years | 9,078 | 202,106 | 20,201,362 |
| 5 to 9 years | 11,056 | 222,571 | 20,348,657 |
| 10 to 14 years | 12,581 | 240,265 | 20,677,194 |
| 15 to 17 years | 8,237 | 152,073 | 12,954,254 |
| 18 and 19 years | 3,960 | 98,761 | 9,086,089 |
| 20 years | 1,684 | 48,139 | 4,519,129 |
| 21 years | 1,665 | 46,335 | 4,354,294 |
| 22 to 24 years | 5,459 | 133,424 | 12,712,576 |
| 25 to 29 years | 8,689 | 214,145 | 21,101,849 |
| 30 to 34 years | 8,860 | 206,232 | 19,962,099 |
| 35 to 39 years | 10,897 | 222,401 | 20,179,642 |
| 40 to 44 years | 14,557 | 262,037 | 20,890,964 |
| 45 to 49 years | 16,976 | 291,272 | 22,708,591 |
| 50 to 54 years | 17,565 | 284,325 | 22,298,125 |
| 55 to 59 years | 15,258 | 240,157 | 19,664,805 |
| 60 and 61 years | 5,451 | 84,356 | 7,113,727 |
| 62 to 64 years | 7,612 | 118,939 | 9,704,197 |
| 65 and 66 years | 4,080 | 64,434 | 5,319,902 |
| 67 to 69 years | 5,333 | 84,847 | 7,115,361 |
| 70 to 74 years | 6,531 | 105,663 | 9,278,166 |
| 75 to 79 years | 5,204 | 89,252 | 7,317,795 |
| 80 to 84 years | 4,354 | 77,465 | 5,743,327 |
| 85 years and over | 4,840 | 84,898 | 5,493,433 |
| MEDIAN AGE BY SEX | |||
| Both sexes Map | 44.40 | 40.00 | 37.20 |
| Male Map | 43.40 | 38.50 | 35.80 |
| Female Map | 45.40 | 41.30 | 38.50 |
| HOUSEHOLDS | |||
| Total Households Map | 76,640 | 1,371,087 | 116,716,292 |
| HOUSEHOLDS, HOUSEHOLD TYPE | |||
| Family households: Map | 51,530 | 908,661 | 77,538,296 |
| Husband-wife family Map | 41,185 | 672,013 | 56,510,377 |
| Other family: Map | 10,345 | 236,648 | 21,027,919 |
| Male householder, no wife present Map | 3,138 | 59,675 | 5,777,570 |
| Female householder, no husband present Map | 7,207 | 176,973 | 15,250,349 |
| Nonfamily households: Map | 25,110 | 462,426 | 39,177,996 |
| Householder living alone Map | 20,403 | 373,648 | 31,204,909 |
| Householder not living alone Map | 4,707 | 88,778 | 7,973,087 |
| HOUSEHOLDS, HISPANIC OR LATINO ORIGIN OF HOUSEHOLDER | |||
| Not Hispanic or Latino householder: Map | 74,401 | 1,234,310 | 103,254,926 |
| Hispanic or Latino householder: Map | 2,239 | 136,777 | 13,461,366 |
| HOUSEHOLDS, RACE OF HOUSEHOLDER | |||
| Householder who is White alone | 73,329 | 1,118,798 | 89,754,352 |
| Householder who is Black or African American alone | 914 | 126,729 | 14,129,983 |
| Householder who is American Indian and Alaska Native alone | 155 | 3,856 | 939,707 |
| Householder who is Asian alone | 820 | 41,812 | 4,632,164 |
| Householder who is Native Hawaiian and Other Pacific Islander alone | 12 | 406 | 143,932 |
| Householder who is Some Other Race alone | 753 | 57,489 | 4,916,427 |
| Householder who is Two or More Races | 657 | 21,997 | 2,199,727 |
| HOUSEHOLDS, HOUSEHOLD TYPE BY HOUSEHOLD SIZE | |||
| Family households: Map | 51,530 | 908,661 | 77,538,296 |
| 2-person household Map | 23,240 | 369,216 | 31,882,616 |
| 3-person household Map | 11,942 | 217,411 | 17,765,829 |
| 4-person household Map | 10,398 | 193,491 | 15,214,075 |
| 5-person household Map | 4,086 | 83,677 | 7,411,997 |
| 6-person household Map | 1,261 | 28,907 | 3,026,278 |
| 7-or-more-person household Map | 603 | 15,959 | 2,237,501 |
| Nonfamily households: Map | 25,110 | 462,426 | 39,177,996 |
| 1-person household Map | 20,403 | 373,648 | 31,204,909 |
| 2-person household Map | 4,166 | 73,879 | 6,360,012 |
| 3-person household Map | 367 | 9,247 | 992,156 |
| 4-person household Map | 111 | 3,625 | 411,171 |
| 5-person household Map | 47 | 1,239 | 126,634 |
| 6-person household Map | 10 | 441 | 48,421 |
| 7-or-more-person household Map | 6 | 347 | 34,693 |
| HOUSING UNITS | |||
| Total Housing Units Map | 87,550 | 1,487,891 | 131,704,730 |
| HOUSING UNITS, OCCUPANCY STATUS | |||
| Occupied Map | 76,640 | 1,371,087 | 116,716,292 |
| Vacant Map | 10,910 | 116,804 | 14,988,438 |
| HOUSING UNITS, OCCUPIED, TENURE | |||
| Owned with a mortgage or a loan Map | 42,758 | 680,960 | 52,979,430 |
| Owned free and clear Map | 15,697 | 244,326 | 23,006,644 |
| Renter occupied Map | 18,185 | 445,801 | 40,730,218 |
| HOUSING UNITS, VACANT, VACANCY STATUS | |||
| For rent Map | 1,634 | 40,004 | 4,137,567 |
| Rented, not occupied Map | 106 | 1,960 | 206,825 |
| For sale only Map | 1,208 | 15,564 | 1,896,796 |
| Sold, not occupied Map | 280 | 3,729 | 421,032 |
| For seasonal, recreational, or occasional use Map | 5,795 | 29,618 | 4,649,298 |
| For migrant workers Map | 3 | 55 | 24,161 |
| Other vacant Map | 1,884 | 25,874 | 3,652,759 |
| HOUSING UNITS, OCCUPIED, AVERAGE HOUSEHOLD SIZE BY TENURE | |||
| Total: Map | 2.44 | 2.52 | 2.58 |
| Owner occupied Map | 2.57 | 2.64 | 2.65 |
| Renter occupied Map | 2.02 | 2.27 | 2.44 |
| HOUSING UNITS, OCCUPIED, TENURE BY RACE OF HOUSEHOLDER | |||
| Owner occupied: Map | 58,455 | 925,286 | 75,986,074 |
| Householder who is White alone Map | 56,634 | 825,201 | 63,446,275 |
| Householder who is Black or African American alone Map | 470 | 50,482 | 6,261,464 |
| Householder who is American Indian and Alaska Native alone Map | 79 | 1,726 | 509,588 |
| Householder who is Asian alone Map | 608 | 23,507 | 2,688,861 |
| Householder who is Native Hawaiian and Other Pacific Islander alone Map | 7 | 172 | 61,911 |
| Householder who is Some Other Race alone Map | 290 | 14,728 | 1,975,817 |
| Householder who is Two or More Races Map | 367 | 9,470 | 1,042,158 |
| Renter occupied: Map | 18,185 | 445,801 | 40,730,218 |
| Householder who is White alone Map | 16,695 | 293,597 | 26,308,077 |
| Householder who is Black or African American alone Map | 444 | 76,247 | 7,868,519 |
| Householder who is American Indian and Alaska Native alone Map | 76 | 2,130 | 430,119 |
| Householder who is Asian alone Map | 212 | 18,305 | 1,943,303 |
| Householder who is Native Hawaiian and Other Pacific Islander alone Map | 5 | 234 | 82,021 |
| Householder who is Some Other Race alone Map | 463 | 42,761 | 2,940,610 |
| Householder who is Two or More Races Map | 290 | 12,527 | 1,157,569 |
| HOUSING UNITS, OCCUPIED, TENURE BY HISPANIC OR LATINO ORIGIN OF HOUSEHOLDER | |||
| Owner occupied: Map | 58,455 | 925,286 | 75,986,074 |
| Not Hispanic or Latino householder Map | 57,354 | 879,820 | 69,617,625 |
| Hispanic or Latino householder Map | 1,101 | 45,466 | 6,368,449 |
| Renter occupied: Map | 18,185 | 445,801 | 40,730,218 |
| Not Hispanic or Latino householder Map | 17,047 | 354,490 | 33,637,301 |
| Hispanic or Latino householder Map | 1,138 | 91,311 | 7,092,917 |
| HOUSING UNITS, OCCUPIED, TENURE BY HOUSEHOLD SIZE | |||
| Owner occupied: Map | 58,455 | 925,286 | 75,986,074 |
| 1-person household Map | 12,000 | 195,555 | 16,453,569 |
| 2-person household Map | 22,442 | 325,808 | 27,618,605 |
| 3-person household Map | 9,982 | 160,024 | 12,517,563 |
| 4-person household Map | 8,996 | 150,836 | 10,998,793 |
| 5-person household Map | 3,494 | 62,773 | 5,057,765 |
| 6-person household Map | 1,050 | 20,237 | 1,965,796 |
| 7-or-more-person household Map | 491 | 10,053 | 1,373,983 |
| Renter occupied: Map | 18,185 | 445,801 | 40,730,218 |
| 1-person household Map | 8,403 | 178,093 | 14,751,340 |
| 2-person household Map | 4,964 | 117,287 | 10,624,023 |
| 3-person household Map | 2,327 | 66,634 | 6,240,422 |
| 4-person household Map | 1,513 | 46,280 | 4,626,453 |
| 5-person household Map | 639 | 22,143 | 2,480,866 |
| 6-person household Map | 221 | 9,111 | 1,108,903 |
| 7-or-more-person household Map | 118 | 6,253 | 898,211 |
Loading...