


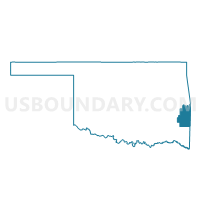
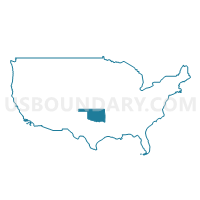
Census Tract 401.02, Le Flore County, Oklahoma
About
Outline

Summary
| Unique Area Identifier | 485314 |
| Name | Census Tract 401.02 |
| County | Le Flore County |
| State | Oklahoma |
| Area (square miles) | 39.16 |
| Land Area (square miles) | 38.85 |
| Water Area (square miles) | 0.31 |
| % of Land Area | 99.20 |
| % of Water Area | 0.80 |
| Latitude of the Internal Point | 35.24100310 |
| Longtitude of the Internal Point | -94.49222970 |
| Total Population | 4,398 |
| Total Housing Units | 1,877 |
| Total Households | 1,746 |
| Median Age | 41 |
Maps

Graphs
Select a template below for downloading or customizing gragh for Census Tract 401.02, Le Flore County, Oklahoma


Neighbors
Neighoring Census Tract (by Name) Neighboring Census Tract on the Map
- Census Tract 103.01, Sebastian County, AR
- Census Tract 13.03, Sebastian County, AR
- Census Tract 13.04, Sebastian County, AR
- Census Tract 401.98, Le Flore County, OK
- Census Tract 403.02, Le Flore County, OK
- Census Tract 403.03, Le Flore County, OK
Top 10 Neighboring County Subdivision (by Population) Neighboring County Subdivision on the Map
- Lon Norris township, Sebastian County, AR (8,133)
- Spiro CCD, Le Flore County, OK (7,577)
- Marion township, Sebastian County, AR (4,689)
- Pocola CCD, Le Flore County, OK (4,398)
- Cameron CCD, Le Flore County, OK (3,806)
- Arkoma CCD, Le Flore County, OK (2,082)
- Cole township, Sebastian County, AR (1,908)
Top 10 Neighboring Place (by Population) Neighboring Place on the Map
- Fort Smith city, AR (86,209)
- Pocola town, OK (4,056)
- Arkoma town, OK (1,989)
- Rock Island town, OK (646)
- Bonanza city, AR (575)
Top 10 Neighboring Unified School District (by Population) Neighboring Unified School District on the Map
- Fort Smith Public Schools, AR (89,450)
- Greenwood School District, AR (19,838)
- Spiro Public Schools, OK (6,875)
- Pocola Public Schools, OK (3,946)
- Hackett Public Schools, AR (2,923)
- Cameron Public Schools, OK (2,229)
- Arkoma Public Schools, OK (2,079)
Top 10 Neighboring State Legislative District Lower Chamber (by Population) Neighboring State Legislative District Lower Chamber on the Map
- State House District 3, OK (35,355)
- State House District 63, AR (30,811)
- State House District 64, AR (27,265)
- State House District 62, AR (27,262)
Top 10 Neighboring State Legislative District Upper Chamber (by Population) Neighboring State Legislative District Upper Chamber on the Map
- State Senate District 6, AR (89,072)
- State Senate District 13, AR (82,857)
- State Senate District 4, OK (78,222)
Top 10 Neighboring 111th Congressional District (by Population) Neighboring 111th Congressional District on the Map
Top 10 Neighboring 5-Digit ZIP Code Tabulation Area (by Population) Neighboring 5-Digit ZIP Code Tabulation Area on the Map
- 72908, AR (13,378)
- 72916, AR (7,131)
- 74959, OK (6,736)
- 74902, OK (4,095)
- 72937, AR (3,858)
- 74932, OK (2,286)
- 74901, OK (1,992)
Data
Demographic, Population, Households, and Housing Units
** Data sources from census 2010 **
Show Data on Map
Download Full List as CSV
Download Quick Sheet as CSV
| Subject | This Area | Le Flore County | Oklahoma | National |
|---|---|---|---|---|
| POPULATION | ||||
| Total Population Map | 4,398 | 50,384 | 3,751,351 | 308,745,538 |
| POPULATION, HISPANIC OR LATINO ORIGIN | ||||
| Not Hispanic or Latino Map | 4,279 | 46,930 | 3,419,344 | 258,267,944 |
| Hispanic or Latino Map | 119 | 3,454 | 332,007 | 50,477,594 |
| POPULATION, RACE | ||||
| White alone Map | 3,718 | 37,827 | 2,706,845 | 223,553,265 |
| Black or African American alone Map | 117 | 1,034 | 277,644 | 38,929,319 |
| American Indian and Alaska Native alone Map | 311 | 6,180 | 321,687 | 2,932,248 |
| Asian alone Map | 19 | 265 | 65,076 | 14,674,252 |
| Native Hawaiian and Other Pacific Islander alone Map | 0 | 24 | 4,369 | 540,013 |
| Some Other Race alone Map | 32 | 2,035 | 154,409 | 19,107,368 |
| Two or More Races Map | 201 | 3,019 | 221,321 | 9,009,073 |
| POPULATION, SEX | ||||
| Male Map | 2,148 | 25,296 | 1,856,977 | 151,781,326 |
| Female Map | 2,250 | 25,088 | 1,894,374 | 156,964,212 |
| POPULATION, AGE (18 YEARS) | ||||
| 18 years and over Map | 3,365 | 37,939 | 2,821,685 | 234,564,071 |
| Under 18 years | 1,033 | 12,445 | 929,666 | 74,181,467 |
| POPULATION, AGE | ||||
| Under 5 years | 241 | 3,438 | 264,126 | 20,201,362 |
| 5 to 9 years | 289 | 3,516 | 259,336 | 20,348,657 |
| 10 to 14 years | 307 | 3,387 | 253,664 | 20,677,194 |
| 15 to 17 years | 196 | 2,104 | 152,540 | 12,954,254 |
| 18 and 19 years | 128 | 1,468 | 111,944 | 9,086,089 |
| 20 years | 43 | 678 | 56,068 | 4,519,129 |
| 21 years | 49 | 614 | 54,032 | 4,354,294 |
| 22 to 24 years | 112 | 1,746 | 159,142 | 12,712,576 |
| 25 to 29 years | 232 | 3,083 | 265,737 | 21,101,849 |
| 30 to 34 years | 264 | 3,026 | 241,018 | 19,962,099 |
| 35 to 39 years | 268 | 3,015 | 232,742 | 20,179,642 |
| 40 to 44 years | 295 | 3,111 | 228,195 | 20,890,964 |
| 45 to 49 years | 305 | 3,529 | 261,242 | 22,708,591 |
| 50 to 54 years | 365 | 3,585 | 264,369 | 22,298,125 |
| 55 to 59 years | 339 | 3,291 | 235,969 | 19,664,805 |
| 60 and 61 years | 106 | 1,299 | 85,815 | 7,113,727 |
| 62 to 64 years | 181 | 1,853 | 118,698 | 9,704,197 |
| 65 and 66 years | 83 | 1,074 | 68,668 | 5,319,902 |
| 67 to 69 years | 132 | 1,397 | 90,724 | 7,115,361 |
| 70 to 74 years | 172 | 2,002 | 121,075 | 9,278,166 |
| 75 to 79 years | 117 | 1,365 | 95,051 | 7,317,795 |
| 80 to 84 years | 85 | 948 | 69,284 | 5,743,327 |
| 85 years and over | 89 | 855 | 61,912 | 5,493,433 |
| MEDIAN AGE BY SEX | ||||
| Both sexes Map | 41.00 | 38.60 | 36.20 | 37.20 |
| Male Map | 39.80 | 37.20 | 34.90 | 35.80 |
| Female Map | 42.50 | 40.00 | 37.70 | 38.50 |
| HOUSEHOLDS | ||||
| Total Households Map | 1,746 | 18,878 | 1,460,450 | 116,716,292 |
| HOUSEHOLDS, HOUSEHOLD TYPE | ||||
| Family households: Map | 1,211 | 13,455 | 975,267 | 77,538,296 |
| Husband-wife family Map | 915 | 10,159 | 722,435 | 56,510,377 |
| Other family: Map | 296 | 3,296 | 252,832 | 21,027,919 |
| Male householder, no wife present Map | 81 | 1,028 | 73,524 | 5,777,570 |
| Female householder, no husband present Map | 215 | 2,268 | 179,308 | 15,250,349 |
| Nonfamily households: Map | 535 | 5,423 | 485,183 | 39,177,996 |
| Householder living alone Map | 468 | 4,691 | 401,153 | 31,204,909 |
| Householder not living alone Map | 67 | 732 | 84,030 | 7,973,087 |
| HOUSEHOLDS, HISPANIC OR LATINO ORIGIN OF HOUSEHOLDER | ||||
| Not Hispanic or Latino householder: Map | 1,721 | 18,180 | 1,375,637 | 103,254,926 |
| Hispanic or Latino householder: Map | 25 | 698 | 84,813 | 13,461,366 |
| HOUSEHOLDS, RACE OF HOUSEHOLDER | ||||
| Householder who is White alone | 1,502 | 15,161 | 1,126,295 | 89,754,352 |
| Householder who is Black or African American alone | 55 | 329 | 105,046 | 14,129,983 |
| Householder who is American Indian and Alaska Native alone | 122 | 2,001 | 104,630 | 939,707 |
| Householder who is Asian alone | 4 | 69 | 20,120 | 4,632,164 |
| Householder who is Native Hawaiian and Other Pacific Islander alone | 0 | 8 | 1,191 | 143,932 |
| Householder who is Some Other Race alone | 6 | 455 | 41,632 | 4,916,427 |
| Householder who is Two or More Races | 57 | 855 | 61,536 | 2,199,727 |
| HOUSEHOLDS, HOUSEHOLD TYPE BY HOUSEHOLD SIZE | ||||
| Family households: Map | 1,211 | 13,455 | 975,267 | 77,538,296 |
| 2-person household Map | 547 | 5,969 | 434,417 | 31,882,616 |
| 3-person household Map | 285 | 2,968 | 219,620 | 17,765,829 |
| 4-person household Map | 215 | 2,405 | 178,628 | 15,214,075 |
| 5-person household Map | 112 | 1,294 | 87,900 | 7,411,997 |
| 6-person household Map | 30 | 523 | 34,017 | 3,026,278 |
| 7-or-more-person household Map | 22 | 296 | 20,685 | 2,237,501 |
| Nonfamily households: Map | 535 | 5,423 | 485,183 | 39,177,996 |
| 1-person household Map | 468 | 4,691 | 401,153 | 31,204,909 |
| 2-person household Map | 59 | 594 | 68,240 | 6,360,012 |
| 3-person household Map | 6 | 83 | 10,338 | 992,156 |
| 4-person household Map | 2 | 41 | 3,939 | 411,171 |
| 5-person household Map | 0 | 10 | 993 | 126,634 |
| 6-person household Map | 0 | 2 | 326 | 48,421 |
| 7-or-more-person household Map | 0 | 2 | 194 | 34,693 |
| HOUSING UNITS | ||||
| Total Housing Units Map | 1,877 | 21,448 | 1,664,378 | 131,704,730 |
| HOUSING UNITS, OCCUPANCY STATUS | ||||
| Occupied Map | 1,746 | 18,878 | 1,460,450 | 116,716,292 |
| Vacant Map | 131 | 2,570 | 203,928 | 14,988,438 |
| HOUSING UNITS, OCCUPIED, TENURE | ||||
| Owned with a mortgage or a loan Map | 761 | 7,378 | 611,266 | 52,979,430 |
| Owned free and clear Map | 621 | 6,670 | 370,494 | 23,006,644 |
| Renter occupied Map | 364 | 4,830 | 478,690 | 40,730,218 |
| HOUSING UNITS, VACANT, VACANCY STATUS | ||||
| For rent Map | 40 | 638 | 59,264 | 4,137,567 |
| Rented, not occupied Map | 2 | 41 | 2,717 | 206,825 |
| For sale only Map | 12 | 225 | 22,671 | 1,896,796 |
| Sold, not occupied Map | 0 | 82 | 8,405 | 421,032 |
| For seasonal, recreational, or occasional use Map | 10 | 365 | 35,187 | 4,649,298 |
| For migrant workers Map | 0 | 1 | 318 | 24,161 |
| Other vacant Map | 67 | 1,218 | 75,366 | 3,652,759 |
| HOUSING UNITS, OCCUPIED, AVERAGE HOUSEHOLD SIZE BY TENURE | ||||
| Total: Map | 2.48 | 2.58 | 2.49 | 2.58 |
| Owner occupied Map | 2.46 | 2.57 | 2.54 | 2.65 |
| Renter occupied Map | 2.52 | 2.63 | 2.38 | 2.44 |
| HOUSING UNITS, OCCUPIED, TENURE BY RACE OF HOUSEHOLDER | ||||
| Owner occupied: Map | 1,382 | 14,048 | 981,760 | 75,986,074 |
| Householder who is White alone Map | 1,197 | 11,599 | 802,001 | 63,446,275 |
| Householder who is Black or African American alone Map | 46 | 237 | 43,781 | 6,261,464 |
| Householder who is American Indian and Alaska Native alone Map | 92 | 1,434 | 67,547 | 509,588 |
| Householder who is Asian alone Map | 3 | 47 | 11,960 | 2,688,861 |
| Householder who is Native Hawaiian and Other Pacific Islander alone Map | 0 | 4 | 446 | 61,911 |
| Householder who is Some Other Race alone Map | 3 | 135 | 19,101 | 1,975,817 |
| Householder who is Two or More Races Map | 41 | 592 | 36,924 | 1,042,158 |
| Renter occupied: Map | 364 | 4,830 | 478,690 | 40,730,218 |
| Householder who is White alone Map | 305 | 3,562 | 324,294 | 26,308,077 |
| Householder who is Black or African American alone Map | 9 | 92 | 61,265 | 7,868,519 |
| Householder who is American Indian and Alaska Native alone Map | 30 | 567 | 37,083 | 430,119 |
| Householder who is Asian alone Map | 1 | 22 | 8,160 | 1,943,303 |
| Householder who is Native Hawaiian and Other Pacific Islander alone Map | 0 | 4 | 745 | 82,021 |
| Householder who is Some Other Race alone Map | 3 | 320 | 22,531 | 2,940,610 |
| Householder who is Two or More Races Map | 16 | 263 | 24,612 | 1,157,569 |
| HOUSING UNITS, OCCUPIED, TENURE BY HISPANIC OR LATINO ORIGIN OF HOUSEHOLDER | ||||
| Owner occupied: Map | 1,382 | 14,048 | 981,760 | 75,986,074 |
| Not Hispanic or Latino householder Map | 1,364 | 13,787 | 940,332 | 69,617,625 |
| Hispanic or Latino householder Map | 18 | 261 | 41,428 | 6,368,449 |
| Renter occupied: Map | 364 | 4,830 | 478,690 | 40,730,218 |
| Not Hispanic or Latino householder Map | 357 | 4,393 | 435,305 | 33,637,301 |
| Hispanic or Latino householder Map | 7 | 437 | 43,385 | 7,092,917 |
| HOUSING UNITS, OCCUPIED, TENURE BY HOUSEHOLD SIZE | ||||
| Owner occupied: Map | 1,382 | 14,048 | 981,760 | 75,986,074 |
| 1-person household Map | 350 | 3,203 | 222,740 | 16,453,569 |
| 2-person household Map | 514 | 5,362 | 379,461 | 27,618,605 |
| 3-person household Map | 229 | 2,203 | 156,161 | 12,517,563 |
| 4-person household Map | 171 | 1,786 | 127,864 | 10,998,793 |
| 5-person household Map | 80 | 946 | 59,965 | 5,057,765 |
| 6-person household Map | 19 | 358 | 22,494 | 1,965,796 |
| 7-or-more-person household Map | 19 | 190 | 13,075 | 1,373,983 |
| Renter occupied: Map | 364 | 4,830 | 478,690 | 40,730,218 |
| 1-person household Map | 118 | 1,488 | 178,413 | 14,751,340 |
| 2-person household Map | 92 | 1,201 | 123,196 | 10,624,023 |
| 3-person household Map | 62 | 848 | 73,797 | 6,240,422 |
| 4-person household Map | 46 | 660 | 54,703 | 4,626,453 |
| 5-person household Map | 32 | 358 | 28,928 | 2,480,866 |
| 6-person household Map | 11 | 167 | 11,849 | 1,108,903 |
| 7-or-more-person household Map | 3 | 108 | 7,804 | 898,211 |
Loading...