


Census Tract 9692, Hamilton County, Nebraska
About
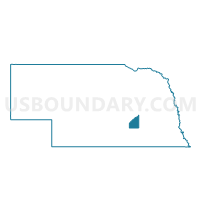
Outline

Summary
| Unique Area Identifier | 470897 |
| Name | Census Tract 9692 |
| County | Hamilton County |
| State | Nebraska |
| Area (square miles) | 283.97 |
| Land Area (square miles) | 280.77 |
| Water Area (square miles) | 3.19 |
| % of Land Area | 98.88 |
| % of Water Area | 1.12 |
| Latitude of the Internal Point | 40.85058640 |
| Longtitude of the Internal Point | -98.12170290 |
| Total Population | 2,482 |
| Total Housing Units | 1,064 |
| Total Households | 939 |
| Median Age | 42.9 |
Maps

Graphs
Select a template below for downloading or customizing gragh for Census Tract 9692, Hamilton County, Nebraska


Neighbors
Neighoring Census Tract (by Name) Neighboring Census Tract on the Map
- Census Tract 13, Hall County, NE
- Census Tract 9621, Clay County, NE
- Census Tract 9654, Adams County, NE
- Census Tract 9667, Merrick County, NE
- Census Tract 9668, Merrick County, NE
- Census Tract 9691, Hamilton County, NE
- Census Tract 9693, Hamilton County, NE
Top 10 Neighboring County Subdivision (by Population) Neighboring County Subdivision on the Map
- Precinct 4, Hamilton County, NE (4,171)
- Harvard township, Clay County, NE (1,145)
- Doniphan township, Hall County, NE (1,099)
- Precinct 6, Hamilton County, NE (1,006)
- Vieregg township, Merrick County, NE (849)
- Precinct 5, Hamilton County, NE (824)
- Precinct 2, Hamilton County, NE (778)
- Lone Tree township, Merrick County, NE (643)
- Precinct 7, Hamilton County, NE (605)
- Precinct 8, Hamilton County, NE (593)
Top 10 Neighboring Place (by Population) Neighboring Place on the Map
- Aurora city, NE (4,479)
- Giltner village, NE (352)
- Phillips village, NE (287)
- Marquette village, NE (229)
- Overland CDP, NE (153)
Top 10 Neighboring Unified School District (by Population) Neighboring Unified School District on the Map
- Aurora Public Schools, NE (6,666)
- Northwest Public Schools, NE (5,807)
- Central City Public Schools, NE (4,655)
- Doniphan-Trumbull Public Schools, NE (2,557)
- Harvard Public Schools, NE (1,304)
- Hampton Public Schools, NE (770)
- Giltner Public Schools, NE (682)
Top 10 Neighboring State Legislative District Upper Chamber (by Population) Neighboring State Legislative District Upper Chamber on the Map
- State Senate District 33, NE (35,648)
- State Senate District 34, NE (35,089)
- State Senate District 38, NE (32,734)
Top 10 Neighboring 111th Congressional District (by Population) Neighboring 111th Congressional District on the Map
Top 10 Neighboring 5-Digit ZIP Code Tabulation Area (by Population) Neighboring 5-Digit ZIP Code Tabulation Area on the Map
- 68801, NE (30,005)
- 68818, NE (5,475)
- 68826, NE (3,955)
- 68832, NE (1,974)
- 68944, NE (1,323)
- 68865, NE (894)
- 68854, NE (731)
- 68827, NE (693)
- 68841, NE (610)
- 68980, NE (388)
Data
Demographic, Population, Households, and Housing Units
** Data sources from census 2010 **
Show Data on Map
Download Full List as CSV
Download Quick Sheet as CSV
| Subject | This Area | Hamilton County | Nebraska | National |
|---|---|---|---|---|
| POPULATION | ||||
| Total Population Map | 2,482 | 9,124 | 1,826,341 | 308,745,538 |
| POPULATION, HISPANIC OR LATINO ORIGIN | ||||
| Not Hispanic or Latino Map | 2,425 | 8,943 | 1,658,936 | 258,267,944 |
| Hispanic or Latino Map | 57 | 181 | 167,405 | 50,477,594 |
| POPULATION, RACE | ||||
| White alone Map | 2,448 | 8,955 | 1,572,838 | 223,553,265 |
| Black or African American alone Map | 3 | 19 | 82,885 | 38,929,319 |
| American Indian and Alaska Native alone Map | 2 | 15 | 18,427 | 2,932,248 |
| Asian alone Map | 0 | 18 | 32,293 | 14,674,252 |
| Native Hawaiian and Other Pacific Islander alone Map | 1 | 1 | 1,279 | 540,013 |
| Some Other Race alone Map | 15 | 51 | 79,109 | 19,107,368 |
| Two or More Races Map | 13 | 65 | 39,510 | 9,009,073 |
| POPULATION, SEX | ||||
| Male Map | 1,301 | 4,564 | 906,296 | 151,781,326 |
| Female Map | 1,181 | 4,560 | 920,045 | 156,964,212 |
| POPULATION, AGE (18 YEARS) | ||||
| 18 years and over Map | 1,841 | 6,785 | 1,367,120 | 234,564,071 |
| Under 18 years | 641 | 2,339 | 459,221 | 74,181,467 |
| POPULATION, AGE | ||||
| Under 5 years | 119 | 526 | 131,908 | 20,201,362 |
| 5 to 9 years | 168 | 638 | 128,928 | 20,348,657 |
| 10 to 14 years | 215 | 712 | 122,706 | 20,677,194 |
| 15 to 17 years | 139 | 463 | 75,679 | 12,954,254 |
| 18 and 19 years | 59 | 211 | 53,251 | 9,086,089 |
| 20 years | 25 | 74 | 26,880 | 4,519,129 |
| 21 years | 18 | 55 | 25,679 | 4,354,294 |
| 22 to 24 years | 47 | 203 | 76,717 | 12,712,576 |
| 25 to 29 years | 112 | 437 | 129,076 | 21,101,849 |
| 30 to 34 years | 118 | 443 | 116,100 | 19,962,099 |
| 35 to 39 years | 128 | 518 | 110,361 | 20,179,642 |
| 40 to 44 years | 160 | 575 | 110,477 | 20,890,964 |
| 45 to 49 years | 243 | 748 | 128,491 | 22,708,591 |
| 50 to 54 years | 226 | 771 | 130,235 | 22,298,125 |
| 55 to 59 years | 200 | 677 | 117,686 | 19,664,805 |
| 60 and 61 years | 92 | 243 | 41,651 | 7,113,727 |
| 62 to 64 years | 91 | 331 | 53,839 | 9,704,197 |
| 65 and 66 years | 50 | 177 | 29,648 | 5,319,902 |
| 67 to 69 years | 73 | 236 | 39,186 | 7,115,361 |
| 70 to 74 years | 83 | 334 | 54,292 | 9,278,166 |
| 75 to 79 years | 56 | 281 | 46,435 | 7,317,795 |
| 80 to 84 years | 36 | 224 | 37,808 | 5,743,327 |
| 85 years and over | 24 | 247 | 39,308 | 5,493,433 |
| MEDIAN AGE BY SEX | ||||
| Both sexes Map | 42.90 | 42.30 | 36.20 | 37.20 |
| Male Map | 42.40 | 40.90 | 35.00 | 35.80 |
| Female Map | 43.30 | 43.80 | 37.50 | 38.50 |
| HOUSEHOLDS | ||||
| Total Households Map | 939 | 3,563 | 721,130 | 116,716,292 |
| HOUSEHOLDS, HOUSEHOLD TYPE | ||||
| Family households: Map | 732 | 2,606 | 467,206 | 77,538,296 |
| Husband-wife family Map | 635 | 2,232 | 366,258 | 56,510,377 |
| Other family: Map | 97 | 374 | 100,948 | 21,027,919 |
| Male householder, no wife present Map | 43 | 128 | 30,223 | 5,777,570 |
| Female householder, no husband present Map | 54 | 246 | 70,725 | 15,250,349 |
| Nonfamily households: Map | 207 | 957 | 253,924 | 39,177,996 |
| Householder living alone Map | 158 | 820 | 206,807 | 31,204,909 |
| Householder not living alone Map | 49 | 137 | 47,117 | 7,973,087 |
| HOUSEHOLDS, HISPANIC OR LATINO ORIGIN OF HOUSEHOLDER | ||||
| Not Hispanic or Latino householder: Map | 928 | 3,521 | 680,066 | 103,254,926 |
| Hispanic or Latino householder: Map | 11 | 42 | 41,064 | 13,461,366 |
| HOUSEHOLDS, RACE OF HOUSEHOLDER | ||||
| Householder who is White alone | 930 | 3,518 | 647,689 | 89,754,352 |
| Householder who is Black or African American alone | 1 | 5 | 30,185 | 14,129,983 |
| Householder who is American Indian and Alaska Native alone | 0 | 3 | 5,162 | 939,707 |
| Householder who is Asian alone | 0 | 4 | 9,801 | 4,632,164 |
| Householder who is Native Hawaiian and Other Pacific Islander alone | 0 | 0 | 384 | 143,932 |
| Householder who is Some Other Race alone | 7 | 18 | 19,845 | 4,916,427 |
| Householder who is Two or More Races | 1 | 15 | 8,064 | 2,199,727 |
| HOUSEHOLDS, HOUSEHOLD TYPE BY HOUSEHOLD SIZE | ||||
| Family households: Map | 732 | 2,606 | 467,206 | 77,538,296 |
| 2-person household Map | 362 | 1,308 | 213,777 | 31,882,616 |
| 3-person household Map | 142 | 474 | 97,236 | 17,765,829 |
| 4-person household Map | 137 | 477 | 85,585 | 15,214,075 |
| 5-person household Map | 49 | 225 | 43,689 | 7,411,997 |
| 6-person household Map | 30 | 83 | 17,008 | 3,026,278 |
| 7-or-more-person household Map | 12 | 39 | 9,911 | 2,237,501 |
| Nonfamily households: Map | 207 | 957 | 253,924 | 39,177,996 |
| 1-person household Map | 158 | 820 | 206,807 | 31,204,909 |
| 2-person household Map | 41 | 110 | 37,383 | 6,360,012 |
| 3-person household Map | 4 | 16 | 6,371 | 992,156 |
| 4-person household Map | 2 | 6 | 2,392 | 411,171 |
| 5-person household Map | 1 | 3 | 663 | 126,634 |
| 6-person household Map | 1 | 1 | 199 | 48,421 |
| 7-or-more-person household Map | 0 | 1 | 109 | 34,693 |
| HOUSING UNITS | ||||
| Total Housing Units Map | 1,064 | 3,968 | 796,793 | 131,704,730 |
| HOUSING UNITS, OCCUPANCY STATUS | ||||
| Occupied Map | 939 | 3,563 | 721,130 | 116,716,292 |
| Vacant Map | 125 | 405 | 75,663 | 14,988,438 |
| HOUSING UNITS, OCCUPIED, TENURE | ||||
| Owned with a mortgage or a loan Map | 450 | 1,613 | 321,481 | 52,979,430 |
| Owned free and clear Map | 348 | 1,120 | 163,249 | 23,006,644 |
| Renter occupied Map | 141 | 830 | 236,400 | 40,730,218 |
| HOUSING UNITS, VACANT, VACANCY STATUS | ||||
| For rent Map | 16 | 75 | 24,404 | 4,137,567 |
| Rented, not occupied Map | 3 | 10 | 1,279 | 206,825 |
| For sale only Map | 16 | 58 | 9,167 | 1,896,796 |
| Sold, not occupied Map | 14 | 30 | 2,804 | 421,032 |
| For seasonal, recreational, or occasional use Map | 20 | 99 | 13,881 | 4,649,298 |
| For migrant workers Map | 0 | 0 | 60 | 24,161 |
| Other vacant Map | 56 | 133 | 24,068 | 3,652,759 |
| HOUSING UNITS, OCCUPIED, AVERAGE HOUSEHOLD SIZE BY TENURE | ||||
| Total: Map | 2.64 | 2.53 | 2.46 | 2.58 |
| Owner occupied Map | 2.63 | 2.61 | 2.58 | 2.65 |
| Renter occupied Map | 2.72 | 2.25 | 2.21 | 2.44 |
| HOUSING UNITS, OCCUPIED, TENURE BY RACE OF HOUSEHOLDER | ||||
| Owner occupied: Map | 798 | 2,733 | 484,730 | 75,986,074 |
| Householder who is White alone Map | 791 | 2,711 | 454,509 | 63,446,275 |
| Householder who is Black or African American alone Map | 1 | 2 | 10,576 | 6,261,464 |
| Householder who is American Indian and Alaska Native alone Map | 0 | 2 | 1,945 | 509,588 |
| Householder who is Asian alone Map | 0 | 2 | 4,773 | 2,688,861 |
| Householder who is Native Hawaiian and Other Pacific Islander alone Map | 0 | 0 | 148 | 61,911 |
| Householder who is Some Other Race alone Map | 6 | 9 | 9,262 | 1,975,817 |
| Householder who is Two or More Races Map | 0 | 7 | 3,517 | 1,042,158 |
| Renter occupied: Map | 141 | 830 | 236,400 | 40,730,218 |
| Householder who is White alone Map | 139 | 807 | 193,180 | 26,308,077 |
| Householder who is Black or African American alone Map | 0 | 3 | 19,609 | 7,868,519 |
| Householder who is American Indian and Alaska Native alone Map | 0 | 1 | 3,217 | 430,119 |
| Householder who is Asian alone Map | 0 | 2 | 5,028 | 1,943,303 |
| Householder who is Native Hawaiian and Other Pacific Islander alone Map | 0 | 0 | 236 | 82,021 |
| Householder who is Some Other Race alone Map | 1 | 9 | 10,583 | 2,940,610 |
| Householder who is Two or More Races Map | 1 | 8 | 4,547 | 1,157,569 |
| HOUSING UNITS, OCCUPIED, TENURE BY HISPANIC OR LATINO ORIGIN OF HOUSEHOLDER | ||||
| Owner occupied: Map | 798 | 2,733 | 484,730 | 75,986,074 |
| Not Hispanic or Latino householder Map | 788 | 2,713 | 464,501 | 69,617,625 |
| Hispanic or Latino householder Map | 10 | 20 | 20,229 | 6,368,449 |
| Renter occupied: Map | 141 | 830 | 236,400 | 40,730,218 |
| Not Hispanic or Latino householder Map | 140 | 808 | 215,565 | 33,637,301 |
| Hispanic or Latino householder Map | 1 | 22 | 20,835 | 7,092,917 |
| HOUSING UNITS, OCCUPIED, TENURE BY HOUSEHOLD SIZE | ||||
| Owner occupied: Map | 798 | 2,733 | 484,730 | 75,986,074 |
| 1-person household Map | 127 | 490 | 105,218 | 16,453,569 |
| 2-person household Map | 359 | 1,186 | 190,253 | 27,618,605 |
| 3-person household Map | 119 | 384 | 71,909 | 12,517,563 |
| 4-person household Map | 114 | 390 | 65,970 | 10,998,793 |
| 5-person household Map | 44 | 186 | 32,518 | 5,057,765 |
| 6-person household Map | 28 | 70 | 12,200 | 1,965,796 |
| 7-or-more-person household Map | 7 | 27 | 6,662 | 1,373,983 |
| Renter occupied: Map | 141 | 830 | 236,400 | 40,730,218 |
| 1-person household Map | 31 | 330 | 101,589 | 14,751,340 |
| 2-person household Map | 44 | 232 | 60,907 | 10,624,023 |
| 3-person household Map | 27 | 106 | 31,698 | 6,240,422 |
| 4-person household Map | 25 | 93 | 22,007 | 4,626,453 |
| 5-person household Map | 6 | 42 | 11,834 | 2,480,866 |
| 6-person household Map | 3 | 14 | 5,007 | 1,108,903 |
| 7-or-more-person household Map | 5 | 13 | 3,358 | 898,211 |
Loading...