


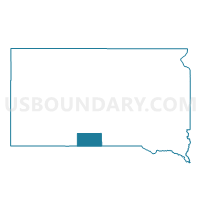
Census Tract 9402, Todd County, South Dakota
About
Outline

Summary
| Unique Area Identifier | 491646 |
| Name | Census Tract 9402 |
| County | Todd County |
| State | South Dakota |
| Area (square miles) | 917.26 |
| Land Area (square miles) | 915.32 |
| Water Area (square miles) | 1.94 |
| % of Land Area | 99.79 |
| % of Water Area | 0.21 |
| Latitude of the Internal Point | 43.24209570 |
| Longtitude of the Internal Point | -100.61179700 |
| Total Population | 5,161 |
| Total Housing Units | 1,826 |
| Total Households | 1,600 |
| Median Age | 24.3 |
Maps

Graphs
Select a template below for downloading or customizing gragh for Census Tract 9402, Todd County, South Dakota


Neighbors
Neighoring Census Tract (by Name) Neighboring Census Tract on the Map
- Census Tract 9401, Todd County, SD
- Census Tract 9403, Mellette County, SD
- Census Tract 9412, Jackson County, SD
- Census Tract 9412, Bennett County, SD
- Census Tract 9558, Cherry County, NE
- Census Tract 9716, Tripp County, SD
- Census Tract 9754, Keya Paha County, NE
Top 10 Neighboring County Subdivision (by Population) Neighboring County Subdivision on the Map
- West Todd UT, Todd County, SD (4,863)
- East Todd UT, Todd County, SD (2,858)
- Mission city, Todd County, SD (1,182)
- East Bennett UT, Bennett County, SD (992)
- Valentine precinct, Cherry County, NE (799)
- Central Mellette UT, Mellette County, SD (687)
- Norris township, Mellette County, SD (189)
- Southeast Jackson UT, Jackson County, SD (187)
- Crookston precinct, Cherry County, NE (182)
- Norden precinct, Keya Paha County, NE (106)
Top 10 Neighboring Place (by Population) Neighboring Place on the Map
- Mission city, SD (1,182)
- Antelope CDP, SD (826)
- Parmelee CDP, SD (562)
- White Horse CDP, SD (276)
- Okreek CDP, SD (269)
- Soldier Creek CDP, SD (227)
Top 10 Neighboring Unified School District (by Population) Neighboring Unified School District on the Map
- Todd County School District 66-1, SD (9,612)
- Winner School District 59-2, SD (4,660)
- Valentine Community Schools, NE (4,515)
- Bennett County School District 03-1, SD (3,431)
- Kadoka School District 35-2, SD (3,298)
- White River School District 47-1, SD (1,782)
- Colome Consolidated School District 59-3, SD (1,212)
- Keya Paha County Schools, NE (826)
Top 10 Neighboring State Legislative District Lower Chamber (by Population) Neighboring State Legislative District Lower Chamber on the Map
- State House District 27, SD (21,985)
- State House District 26A, SD (11,660)
- State House District 26B, SD (9,915)
Top 10 Neighboring State Legislative District Upper Chamber (by Population) Neighboring State Legislative District Upper Chamber on the Map
- State Senate District 43, NE (31,106)
- State Senate District 27, SD (21,985)
- State Senate District 26, SD (21,575)
Top 10 Neighboring 111th Congressional District (by Population) Neighboring 111th Congressional District on the Map
Top 10 Neighboring 5-Digit ZIP Code Tabulation Area (by Population) Neighboring 5-Digit ZIP Code Tabulation Area on the Map
- 57580, SD (4,449)
- 69201, NE (4,005)
- 57555, SD (3,834)
- 57570, SD (2,064)
- 57579, SD (1,330)
- 57566, SD (1,060)
- 57560, SD (436)
- 69212, NE (248)
- 57563, SD (240)
- 57585, SD (226)
Data
Demographic, Population, Households, and Housing Units
** Data sources from census 2010 **
Show Data on Map
Download Full List as CSV
Download Quick Sheet as CSV
| Subject | This Area | Todd County | South Dakota | National |
|---|---|---|---|---|
| POPULATION | ||||
| Total Population Map | 5,161 | 9,612 | 814,180 | 308,745,538 |
| POPULATION, HISPANIC OR LATINO ORIGIN | ||||
| Not Hispanic or Latino Map | 5,066 | 9,385 | 792,061 | 258,267,944 |
| Hispanic or Latino Map | 95 | 227 | 22,119 | 50,477,594 |
| POPULATION, RACE | ||||
| White alone Map | 679 | 921 | 699,392 | 223,553,265 |
| Black or African American alone Map | 9 | 16 | 10,207 | 38,929,319 |
| American Indian and Alaska Native alone Map | 4,323 | 8,468 | 71,817 | 2,932,248 |
| Asian alone Map | 17 | 18 | 7,610 | 14,674,252 |
| Native Hawaiian and Other Pacific Islander alone Map | 0 | 0 | 394 | 540,013 |
| Some Other Race alone Map | 15 | 20 | 7,477 | 19,107,368 |
| Two or More Races Map | 118 | 169 | 17,283 | 9,009,073 |
| POPULATION, SEX | ||||
| Male Map | 2,491 | 4,723 | 407,381 | 151,781,326 |
| Female Map | 2,670 | 4,889 | 406,799 | 156,964,212 |
| POPULATION, AGE (18 YEARS) | ||||
| 18 years and over Map | 3,100 | 5,755 | 611,383 | 234,564,071 |
| Under 18 years | 2,061 | 3,857 | 202,797 | 74,181,467 |
| POPULATION, AGE | ||||
| Under 5 years | 697 | 1,211 | 59,621 | 20,201,362 |
| 5 to 9 years | 599 | 1,145 | 55,531 | 20,348,657 |
| 10 to 14 years | 501 | 960 | 53,960 | 20,677,194 |
| 15 to 17 years | 264 | 541 | 33,685 | 12,954,254 |
| 18 and 19 years | 143 | 333 | 23,943 | 9,086,089 |
| 20 years | 71 | 151 | 11,907 | 4,519,129 |
| 21 years | 91 | 160 | 11,739 | 4,354,294 |
| 22 to 24 years | 278 | 466 | 33,950 | 12,712,576 |
| 25 to 29 years | 387 | 731 | 55,570 | 21,101,849 |
| 30 to 34 years | 306 | 515 | 49,859 | 19,962,099 |
| 35 to 39 years | 293 | 535 | 45,766 | 20,179,642 |
| 40 to 44 years | 224 | 484 | 47,346 | 20,890,964 |
| 45 to 49 years | 267 | 518 | 57,519 | 22,708,591 |
| 50 to 54 years | 231 | 483 | 59,399 | 22,298,125 |
| 55 to 59 years | 256 | 431 | 54,231 | 19,664,805 |
| 60 and 61 years | 90 | 155 | 18,999 | 7,113,727 |
| 62 to 64 years | 110 | 200 | 24,574 | 9,704,197 |
| 65 and 66 years | 55 | 97 | 13,621 | 5,319,902 |
| 67 to 69 years | 62 | 104 | 18,323 | 7,115,361 |
| 70 to 74 years | 83 | 146 | 25,683 | 9,278,166 |
| 75 to 79 years | 65 | 114 | 21,724 | 7,317,795 |
| 80 to 84 years | 60 | 79 | 18,004 | 5,743,327 |
| 85 years and over | 28 | 53 | 19,226 | 5,493,433 |
| MEDIAN AGE BY SEX | ||||
| Both sexes Map | 24.30 | 24.00 | 36.90 | 37.20 |
| Male Map | 23.30 | 22.70 | 35.60 | 35.80 |
| Female Map | 25.00 | 24.90 | 38.20 | 38.50 |
| HOUSEHOLDS | ||||
| Total Households Map | 1,600 | 2,780 | 322,282 | 116,716,292 |
| HOUSEHOLDS, HOUSEHOLD TYPE | ||||
| Family households: Map | 1,206 | 2,091 | 206,964 | 77,538,296 |
| Husband-wife family Map | 467 | 791 | 161,617 | 56,510,377 |
| Other family: Map | 739 | 1,300 | 45,347 | 21,027,919 |
| Male householder, no wife present Map | 190 | 335 | 14,233 | 5,777,570 |
| Female householder, no husband present Map | 549 | 965 | 31,114 | 15,250,349 |
| Nonfamily households: Map | 394 | 689 | 115,318 | 39,177,996 |
| Householder living alone Map | 342 | 586 | 94,638 | 31,204,909 |
| Householder not living alone Map | 52 | 103 | 20,680 | 7,973,087 |
| HOUSEHOLDS, HISPANIC OR LATINO ORIGIN OF HOUSEHOLDER | ||||
| Not Hispanic or Latino householder: Map | 1,581 | 2,743 | 316,719 | 103,254,926 |
| Hispanic or Latino householder: Map | 19 | 37 | 5,563 | 13,461,366 |
| HOUSEHOLDS, RACE OF HOUSEHOLDER | ||||
| Householder who is White alone | 326 | 440 | 292,219 | 89,754,352 |
| Householder who is Black or African American alone | 3 | 5 | 3,029 | 14,129,983 |
| Householder who is American Indian and Alaska Native alone | 1,221 | 2,271 | 18,966 | 939,707 |
| Householder who is Asian alone | 5 | 5 | 2,199 | 4,632,164 |
| Householder who is Native Hawaiian and Other Pacific Islander alone | 0 | 0 | 111 | 143,932 |
| Householder who is Some Other Race alone | 4 | 4 | 2,014 | 4,916,427 |
| Householder who is Two or More Races | 41 | 55 | 3,744 | 2,199,727 |
| HOUSEHOLDS, HOUSEHOLD TYPE BY HOUSEHOLD SIZE | ||||
| Family households: Map | 1,206 | 2,091 | 206,964 | 77,538,296 |
| 2-person household Map | 316 | 479 | 99,234 | 31,882,616 |
| 3-person household Map | 263 | 434 | 41,815 | 17,765,829 |
| 4-person household Map | 258 | 422 | 36,252 | 15,214,075 |
| 5-person household Map | 184 | 335 | 18,345 | 7,411,997 |
| 6-person household Map | 87 | 180 | 6,918 | 3,026,278 |
| 7-or-more-person household Map | 98 | 241 | 4,400 | 2,237,501 |
| Nonfamily households: Map | 394 | 689 | 115,318 | 39,177,996 |
| 1-person household Map | 342 | 586 | 94,638 | 31,204,909 |
| 2-person household Map | 43 | 88 | 16,441 | 6,360,012 |
| 3-person household Map | 5 | 10 | 2,758 | 992,156 |
| 4-person household Map | 2 | 2 | 1,019 | 411,171 |
| 5-person household Map | 1 | 1 | 303 | 126,634 |
| 6-person household Map | 1 | 1 | 95 | 48,421 |
| 7-or-more-person household Map | 0 | 1 | 64 | 34,693 |
| HOUSING UNITS | ||||
| Total Housing Units Map | 1,826 | 3,142 | 363,438 | 131,704,730 |
| HOUSING UNITS, OCCUPANCY STATUS | ||||
| Occupied Map | 1,600 | 2,780 | 322,282 | 116,716,292 |
| Vacant Map | 226 | 362 | 41,156 | 14,988,438 |
| HOUSING UNITS, OCCUPIED, TENURE | ||||
| Owned with a mortgage or a loan Map | 219 | 270 | 133,814 | 52,979,430 |
| Owned free and clear Map | 525 | 993 | 85,744 | 23,006,644 |
| Renter occupied Map | 856 | 1,517 | 102,724 | 40,730,218 |
| HOUSING UNITS, VACANT, VACANCY STATUS | ||||
| For rent Map | 55 | 79 | 10,366 | 4,137,567 |
| Rented, not occupied Map | 8 | 23 | 642 | 206,825 |
| For sale only Map | 3 | 4 | 3,696 | 1,896,796 |
| Sold, not occupied Map | 4 | 6 | 1,314 | 421,032 |
| For seasonal, recreational, or occasional use Map | 30 | 58 | 13,277 | 4,649,298 |
| For migrant workers Map | 0 | 0 | 88 | 24,161 |
| Other vacant Map | 126 | 192 | 11,773 | 3,652,759 |
| HOUSING UNITS, OCCUPIED, AVERAGE HOUSEHOLD SIZE BY TENURE | ||||
| Total: Map | 3.23 | 3.45 | 2.42 | 2.58 |
| Owner occupied Map | 2.91 | 3.11 | 2.53 | 2.65 |
| Renter occupied Map | 3.50 | 3.73 | 2.18 | 2.44 |
| HOUSING UNITS, OCCUPIED, TENURE BY RACE OF HOUSEHOLDER | ||||
| Owner occupied: Map | 744 | 1,263 | 219,558 | 75,986,074 |
| Householder who is White alone Map | 215 | 261 | 208,007 | 63,446,275 |
| Householder who is Black or African American alone Map | 2 | 2 | 747 | 6,261,464 |
| Householder who is American Indian and Alaska Native alone Map | 503 | 968 | 7,391 | 509,588 |
| Householder who is Asian alone Map | 2 | 2 | 958 | 2,688,861 |
| Householder who is Native Hawaiian and Other Pacific Islander alone Map | 0 | 0 | 50 | 61,911 |
| Householder who is Some Other Race alone Map | 0 | 0 | 753 | 1,975,817 |
| Householder who is Two or More Races Map | 22 | 30 | 1,652 | 1,042,158 |
| Renter occupied: Map | 856 | 1,517 | 102,724 | 40,730,218 |
| Householder who is White alone Map | 111 | 179 | 84,212 | 26,308,077 |
| Householder who is Black or African American alone Map | 1 | 3 | 2,282 | 7,868,519 |
| Householder who is American Indian and Alaska Native alone Map | 718 | 1,303 | 11,575 | 430,119 |
| Householder who is Asian alone Map | 3 | 3 | 1,241 | 1,943,303 |
| Householder who is Native Hawaiian and Other Pacific Islander alone Map | 0 | 0 | 61 | 82,021 |
| Householder who is Some Other Race alone Map | 4 | 4 | 1,261 | 2,940,610 |
| Householder who is Two or More Races Map | 19 | 25 | 2,092 | 1,157,569 |
| HOUSING UNITS, OCCUPIED, TENURE BY HISPANIC OR LATINO ORIGIN OF HOUSEHOLDER | ||||
| Owner occupied: Map | 744 | 1,263 | 219,558 | 75,986,074 |
| Not Hispanic or Latino householder Map | 737 | 1,250 | 217,277 | 69,617,625 |
| Hispanic or Latino householder Map | 7 | 13 | 2,281 | 6,368,449 |
| Renter occupied: Map | 856 | 1,517 | 102,724 | 40,730,218 |
| Not Hispanic or Latino householder Map | 844 | 1,493 | 99,442 | 33,637,301 |
| Hispanic or Latino householder Map | 12 | 24 | 3,282 | 7,092,917 |
| HOUSING UNITS, OCCUPIED, TENURE BY HOUSEHOLD SIZE | ||||
| Owner occupied: Map | 744 | 1,263 | 219,558 | 75,986,074 |
| 1-person household Map | 175 | 279 | 48,035 | 16,453,569 |
| 2-person household Map | 214 | 334 | 89,722 | 27,618,605 |
| 3-person household Map | 122 | 215 | 31,852 | 12,517,563 |
| 4-person household Map | 103 | 178 | 28,667 | 10,998,793 |
| 5-person household Map | 61 | 113 | 13,866 | 5,057,765 |
| 6-person household Map | 35 | 63 | 4,880 | 1,965,796 |
| 7-or-more-person household Map | 34 | 81 | 2,536 | 1,373,983 |
| Renter occupied: Map | 856 | 1,517 | 102,724 | 40,730,218 |
| 1-person household Map | 167 | 307 | 46,603 | 14,751,340 |
| 2-person household Map | 145 | 233 | 25,953 | 10,624,023 |
| 3-person household Map | 146 | 229 | 12,721 | 6,240,422 |
| 4-person household Map | 157 | 246 | 8,604 | 4,626,453 |
| 5-person household Map | 124 | 223 | 4,782 | 2,480,866 |
| 6-person household Map | 53 | 118 | 2,133 | 1,108,903 |
| 7-or-more-person household Map | 64 | 161 | 1,928 | 898,211 |
Loading...