


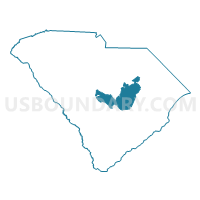
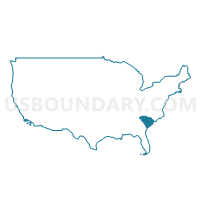
State Senate District 36, South Carolina
About
Outline

Summary
| Unique Area Identifier | 201387 |
| Name | State Senate District 36 |
| State | South Carolina |
| Area (square miles) | 1,401.25 |
| Land Area (square miles) | 1,300.75 |
| Water Area (square miles) | 100.50 |
| % of Land Area | 92.83 |
| % of Water Area | 7.17 |
| Latitude of the Internal Point | 33.72669140 |
| Longtitude of the Internal Point | -80.34287420 |
| Total Population | 84,337 |
| Total Housing Units | 39,607 |
| Total Households | 31,953 |
| Median Age | 40.2 |
Maps
Graphs
Select a template below for downloading or customizing gragh for State Senate District 36, South Carolina


Neighbors
Neighoring State Legislative District Upper Chamber (by Name) Neighboring State Legislative District Upper Chamber on the Map
- State Senate District 21, SC
- State Senate District 26, SC
- State Senate District 29, SC
- State Senate District 31, SC
- State Senate District 32, SC
- State Senate District 35, SC
- State Senate District 37, SC
- State Senate District 39, SC
- State Senate District 40, SC
Top 10 Neighboring County (by Population) Neighboring County on the Map
- Richland County, SC (384,504)
- Lexington County, SC (262,391)
- Berkeley County, SC (177,843)
- Florence County, SC (136,885)
- Sumter County, SC (107,456)
- Orangeburg County, SC (92,501)
- Darlington County, SC (68,681)
- Clarendon County, SC (34,971)
- Williamsburg County, SC (34,423)
- Lee County, SC (19,220)
Top 10 Neighboring County Subdivision (by Population) Neighboring County Subdivision on the Map
- West Columbia-Cayce CCD, Lexington County, SC (61,546)
- Sumter CCD, Sumter County, SC (50,528)
- Orangeburg CCD, Orangeburg County, SC (40,336)
- Swansea CCD, Lexington County, SC (16,186)
- Danwood CCD, Florence County, SC (15,155)
- Manning CCD, Clarendon County, SC (13,826)
- Kingstree CCD, Williamsburg County, SC (13,424)
- Privateer CCD, Sumter County, SC (12,046)
- St. Stephen CCD, Berkeley County, SC (7,204)
- Cross CCD, Berkeley County, SC (7,104)
Top 10 Neighboring Place (by Population) Neighboring Place on the Map
- Sumter city, SC (40,524)
- Manning city, SC (4,108)
- Lakewood CDP, SC (3,032)
- South Sumter CDP, SC (2,411)
- Privateer CDP, SC (2,349)
- Timmonsville town, SC (2,320)
- St. Matthews town, SC (2,021)
- East Sumter CDP, SC (1,343)
- Summerton town, SC (1,000)
- Turbeville town, SC (766)
Top 10 Neighboring Unified School District (by Population) Neighboring Unified School District on the Map
- Richland School District 1, SC (201,528)
- Berkeley County School District, SC (177,843)
- Florence School District 1, SC (96,463)
- Darlington County School District, SC (68,681)
- Lexington School District 2, SC (63,322)
- Sumter School District 2, SC (57,252)
- Orangeburg School District 5, SC (51,950)
- Sumter School District 17, SC (50,204)
- Williamsburg County School District, SC (34,423)
- Florence School District 3, SC (20,584)
Top 10 Neighboring State Legislative District Lower Chamber (by Population) Neighboring State Legislative District Lower Chamber on the Map
- State House District 88, SC (39,968)
- State House District 102, SC (37,248)
- State House District 67, SC (36,320)
- State House District 60, SC (34,706)
- State House District 64, SC (34,361)
- State House District 62, SC (33,398)
- State House District 50, SC (33,358)
- State House District 66, SC (32,845)
- State House District 93, SC (32,607)
- State House District 51, SC (31,515)
Top 10 Neighboring 111th Congressional District (by Population) Neighboring 111th Congressional District on the Map
- Congressional District 2, SC (825,324)
- Congressional District 5, SC (767,773)
- Congressional District 6, SC (682,410)
Top 10 Neighboring Census Tract (by Population) Neighboring Census Tract on the Map
- Census Tract 4, Sumter County, SC (8,538)
- Census Tract 109, Orangeburg County, SC (8,076)
- Census Tract 17.01, Sumter County, SC (6,736)
- Census Tract 118, Richland County, SC (6,424)
- Census Tract 19.01, Sumter County, SC (6,373)
- Census Tract 103, Orangeburg County, SC (6,125)
- Census Tract 9502, Calhoun County, SC (6,122)
- Census Tract 15.04, Florence County, SC (5,939)
- Census Tract 19.02, Sumter County, SC (5,673)
- Census Tract 9501, Calhoun County, SC (5,613)
Top 10 Neighboring 5-Digit ZIP Code Tabulation Area (by Population) Neighboring 5-Digit ZIP Code Tabulation Area on the Map
- 29501, SC (43,220)
- 29150, SC (40,031)
- 29209, SC (33,324)
- 29115, SC (31,128)
- 29154, SC (28,135)
- 29053, SC (18,830)
- 29102, SC (18,248)
- 29118, SC (15,861)
- 29153, SC (15,633)
- 29061, SC (13,717)
Data
Demographic, Population, Households, and Housing Units
** Data sources from census 2010 **
Show Data on Map
Download Full List as CSV
Download Quick Sheet as CSV
| Subject | This Area | South Carolina | National |
|---|---|---|---|
| POPULATION | |||
| Total Population Map | 84,337 | 4,625,364 | 308,745,538 |
| POPULATION, HISPANIC OR LATINO ORIGIN | |||
| Not Hispanic or Latino Map | 81,889 | 4,389,682 | 258,267,944 |
| Hispanic or Latino Map | 2,448 | 235,682 | 50,477,594 |
| POPULATION, RACE | |||
| White alone Map | 35,888 | 3,060,000 | 223,553,265 |
| Black or African American alone Map | 45,712 | 1,290,684 | 38,929,319 |
| American Indian and Alaska Native alone Map | 241 | 19,524 | 2,932,248 |
| Asian alone Map | 353 | 59,051 | 14,674,252 |
| Native Hawaiian and Other Pacific Islander alone Map | 46 | 2,706 | 540,013 |
| Some Other Race alone Map | 1,250 | 113,464 | 19,107,368 |
| Two or More Races Map | 847 | 79,935 | 9,009,073 |
| POPULATION, SEX | |||
| Male Map | 40,773 | 2,250,101 | 151,781,326 |
| Female Map | 43,564 | 2,375,263 | 156,964,212 |
| POPULATION, AGE (18 YEARS) | |||
| 18 years and over Map | 64,277 | 3,544,890 | 234,564,071 |
| Under 18 years | 20,060 | 1,080,474 | 74,181,467 |
| POPULATION, AGE | |||
| Under 5 years | 5,476 | 302,297 | 20,201,362 |
| 5 to 9 years | 5,427 | 295,853 | 20,348,657 |
| 10 to 14 years | 5,542 | 297,286 | 20,677,194 |
| 15 to 17 years | 3,615 | 185,038 | 12,954,254 |
| 18 and 19 years | 2,517 | 143,951 | 9,086,089 |
| 20 years | 1,307 | 73,846 | 4,519,129 |
| 21 years | 1,143 | 69,700 | 4,354,294 |
| 22 to 24 years | 3,065 | 188,948 | 12,712,576 |
| 25 to 29 years | 4,895 | 304,378 | 21,101,849 |
| 30 to 34 years | 4,408 | 287,678 | 19,962,099 |
| 35 to 39 years | 4,526 | 296,682 | 20,179,642 |
| 40 to 44 years | 5,157 | 304,610 | 20,890,964 |
| 45 to 49 years | 6,036 | 332,766 | 22,708,591 |
| 50 to 54 years | 6,517 | 326,662 | 22,298,125 |
| 55 to 59 years | 6,139 | 303,240 | 19,664,805 |
| 60 and 61 years | 2,394 | 115,411 | 7,113,727 |
| 62 to 64 years | 3,342 | 165,144 | 9,704,197 |
| 65 and 66 years | 1,925 | 92,218 | 5,319,902 |
| 67 to 69 years | 2,527 | 123,343 | 7,115,361 |
| 70 to 74 years | 3,219 | 153,482 | 9,278,166 |
| 75 to 79 years | 2,323 | 113,248 | 7,317,795 |
| 80 to 84 years | 1,541 | 78,866 | 5,743,327 |
| 85 years and over | 1,296 | 70,717 | 5,493,433 |
| MEDIAN AGE BY SEX | |||
| Both sexes Map | 40.20 | 37.90 | 37.20 |
| Male Map | 38.00 | 36.40 | 35.80 |
| Female Map | 42.10 | 39.20 | 38.50 |
| HOUSEHOLDS | |||
| Total Households Map | 31,953 | 1,801,181 | 116,716,292 |
| HOUSEHOLDS, HOUSEHOLD TYPE | |||
| Family households: Map | 22,247 | 1,216,415 | 77,538,296 |
| Husband-wife family Map | 13,569 | 849,959 | 56,510,377 |
| Other family: Map | 8,678 | 366,456 | 21,027,919 |
| Male householder, no wife present Map | 1,719 | 85,354 | 5,777,570 |
| Female householder, no husband present Map | 6,959 | 281,102 | 15,250,349 |
| Nonfamily households: Map | 9,706 | 584,766 | 39,177,996 |
| Householder living alone Map | 8,511 | 477,894 | 31,204,909 |
| Householder not living alone Map | 1,195 | 106,872 | 7,973,087 |
| HOUSEHOLDS, HISPANIC OR LATINO ORIGIN OF HOUSEHOLDER | |||
| Not Hispanic or Latino householder: Map | 31,355 | 1,742,066 | 103,254,926 |
| Hispanic or Latino householder: Map | 598 | 59,115 | 13,461,366 |
| HOUSEHOLDS, RACE OF HOUSEHOLDER | |||
| Householder who is White alone | 14,803 | 1,257,573 | 89,754,352 |
| Householder who is Black or African American alone | 16,422 | 472,049 | 14,129,983 |
| Householder who is American Indian and Alaska Native alone | 99 | 7,126 | 939,707 |
| Householder who is Asian alone | 97 | 18,490 | 4,632,164 |
| Householder who is Native Hawaiian and Other Pacific Islander alone | 13 | 754 | 143,932 |
| Householder who is Some Other Race alone | 295 | 27,306 | 4,916,427 |
| Householder who is Two or More Races | 224 | 17,883 | 2,199,727 |
| HOUSEHOLDS, HOUSEHOLD TYPE BY HOUSEHOLD SIZE | |||
| Family households: Map | 22,247 | 1,216,415 | 77,538,296 |
| 2-person household Map | 9,398 | 538,874 | 31,882,616 |
| 3-person household Map | 5,287 | 290,093 | 17,765,829 |
| 4-person household Map | 4,005 | 225,690 | 15,214,075 |
| 5-person household Map | 2,008 | 101,650 | 7,411,997 |
| 6-person household Map | 903 | 37,394 | 3,026,278 |
| 7-or-more-person household Map | 646 | 22,714 | 2,237,501 |
| Nonfamily households: Map | 9,706 | 584,766 | 39,177,996 |
| 1-person household Map | 8,511 | 477,894 | 31,204,909 |
| 2-person household Map | 1,025 | 84,545 | 6,360,012 |
| 3-person household Map | 96 | 14,005 | 992,156 |
| 4-person household Map | 31 | 6,213 | 411,171 |
| 5-person household Map | 27 | 1,364 | 126,634 |
| 6-person household Map | 6 | 439 | 48,421 |
| 7-or-more-person household Map | 10 | 306 | 34,693 |
| HOUSING UNITS | |||
| Total Housing Units Map | 39,607 | 2,137,683 | 131,704,730 |
| HOUSING UNITS, OCCUPANCY STATUS | |||
| Occupied Map | 31,953 | 1,801,181 | 116,716,292 |
| Vacant Map | 7,654 | 336,502 | 14,988,438 |
| HOUSING UNITS, OCCUPIED, TENURE | |||
| Owned with a mortgage or a loan Map | 12,387 | 825,417 | 52,979,430 |
| Owned free and clear Map | 10,452 | 423,388 | 23,006,644 |
| Renter occupied Map | 9,114 | 552,376 | 40,730,218 |
| HOUSING UNITS, VACANT, VACANCY STATUS | |||
| For rent Map | 905 | 92,758 | 4,137,567 |
| Rented, not occupied Map | 136 | 3,957 | 206,825 |
| For sale only Map | 684 | 36,523 | 1,896,796 |
| Sold, not occupied Map | 172 | 8,519 | 421,032 |
| For seasonal, recreational, or occasional use Map | 2,774 | 112,531 | 4,649,298 |
| For migrant workers Map | 26 | 370 | 24,161 |
| Other vacant Map | 2,957 | 81,844 | 3,652,759 |
| HOUSING UNITS, OCCUPIED, AVERAGE HOUSEHOLD SIZE BY TENURE | |||
| Total: Map | 2.58 | 2.49 | 2.58 |
| Owner occupied Map | 2.55 | 2.51 | 2.65 |
| Renter occupied Map | 2.66 | 2.45 | 2.44 |
| HOUSING UNITS, OCCUPIED, TENURE BY RACE OF HOUSEHOLDER | |||
| Owner occupied: Map | 22,839 | 1,248,805 | 75,986,074 |
| Householder who is White alone Map | 12,252 | 955,312 | 63,446,275 |
| Householder who is Black or African American alone Map | 10,251 | 258,651 | 6,261,464 |
| Householder who is American Indian and Alaska Native alone Map | 61 | 4,197 | 509,588 |
| Householder who is Asian alone Map | 59 | 11,541 | 2,688,861 |
| Householder who is Native Hawaiian and Other Pacific Islander alone Map | 4 | 310 | 61,911 |
| Householder who is Some Other Race alone Map | 91 | 9,457 | 1,975,817 |
| Householder who is Two or More Races Map | 121 | 9,337 | 1,042,158 |
| Renter occupied: Map | 9,114 | 552,376 | 40,730,218 |
| Householder who is White alone Map | 2,551 | 302,261 | 26,308,077 |
| Householder who is Black or African American alone Map | 6,171 | 213,398 | 7,868,519 |
| Householder who is American Indian and Alaska Native alone Map | 38 | 2,929 | 430,119 |
| Householder who is Asian alone Map | 38 | 6,949 | 1,943,303 |
| Householder who is Native Hawaiian and Other Pacific Islander alone Map | 9 | 444 | 82,021 |
| Householder who is Some Other Race alone Map | 204 | 17,849 | 2,940,610 |
| Householder who is Two or More Races Map | 103 | 8,546 | 1,157,569 |
| HOUSING UNITS, OCCUPIED, TENURE BY HISPANIC OR LATINO ORIGIN OF HOUSEHOLDER | |||
| Owner occupied: Map | 22,839 | 1,248,805 | 75,986,074 |
| Not Hispanic or Latino householder Map | 22,604 | 1,223,564 | 69,617,625 |
| Hispanic or Latino householder Map | 235 | 25,241 | 6,368,449 |
| Renter occupied: Map | 9,114 | 552,376 | 40,730,218 |
| Not Hispanic or Latino householder Map | 8,751 | 518,502 | 33,637,301 |
| Hispanic or Latino householder Map | 363 | 33,874 | 7,092,917 |
| HOUSING UNITS, OCCUPIED, TENURE BY HOUSEHOLD SIZE | |||
| Owner occupied: Map | 22,839 | 1,248,805 | 75,986,074 |
| 1-person household Map | 5,551 | 289,689 | 16,453,569 |
| 2-person household Map | 8,301 | 477,169 | 27,618,605 |
| 3-person household Map | 3,839 | 210,222 | 12,517,563 |
| 4-person household Map | 2,866 | 164,774 | 10,998,793 |
| 5-person household Map | 1,314 | 69,110 | 5,057,765 |
| 6-person household Map | 557 | 24,016 | 1,965,796 |
| 7-or-more-person household Map | 411 | 13,825 | 1,373,983 |
| Renter occupied: Map | 9,114 | 552,376 | 40,730,218 |
| 1-person household Map | 2,960 | 188,205 | 14,751,340 |
| 2-person household Map | 2,122 | 146,250 | 10,624,023 |
| 3-person household Map | 1,544 | 93,876 | 6,240,422 |
| 4-person household Map | 1,170 | 67,129 | 4,626,453 |
| 5-person household Map | 721 | 33,904 | 2,480,866 |
| 6-person household Map | 352 | 13,817 | 1,108,903 |
| 7-or-more-person household Map | 245 | 9,195 | 898,211 |
Loading...