


Hilltown township, Bucks County, Pennsylvania
About
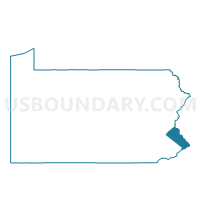
Outline

Summary
| Unique Area Identifier | 149772 |
| Name | Hilltown township |
| County | Bucks County |
| State | Pennsylvania |
| Area (square miles) | 27.03 |
| Land Area (square miles) | 26.97 |
| Water Area (square miles) | 0.06 |
| % of Land Area | 99.76 |
| % of Water Area | 0.24 |
| Latitude of the Internal Point | 40.34252660 |
| Longtitude of the Internal Point | -75.25238810 |
| Total Population | 15,029 |
| Total Housing Units | 5,574 |
| Total Households | 5,386 |
| Median Age | 40.6 |
Maps

Graphs
Select a template below for downloading or customizing gragh for Hilltown township, Bucks County, Pennsylvania


Neighbors
Neighoring County Subdivision (by Name) Neighboring County Subdivision on the Map
- Bedminster township, Bucks County, PA
- Dublin borough, Bucks County, PA
- East Rockhill township, Bucks County, PA
- Franconia township, Montgomery County, PA
- Hatfield township, Montgomery County, PA
- New Britain township, Bucks County, PA
- Perkasie borough, Bucks County, PA
- Plumstead township, Bucks County, PA
- Silverdale borough, Bucks County, PA
- Souderton borough, Montgomery County, PA
- Telford borough, Montgomery County, PA
- Telford borough, Bucks County, PA
- West Rockhill township, Bucks County, PA
Top 10 Neighboring Place (by Population) Neighboring Place on the Map
- Perkasie borough, PA (8,511)
- Souderton borough, PA (6,618)
- Telford borough, PA (4,872)
- Dublin borough, PA (2,158)
- Silverdale borough, PA (871)
Top 10 Neighboring Unified School District (by Population) Neighboring Unified School District on the Map
- Central Bucks School District, PA (114,377)
- North Penn School District, PA (98,175)
- Pennridge School District, PA (48,307)
- Souderton Area School District, PA (45,316)
Top 10 Neighboring State Legislative District Lower Chamber (by Population) Neighboring State Legislative District Lower Chamber on the Map
- State House District 144, PA (68,397)
- State House District 145, PA (65,216)
- State House District 53, PA (63,509)
- State House District 143, PA (62,909)
Top 10 Neighboring State Legislative District Upper Chamber (by Population) Neighboring State Legislative District Upper Chamber on the Map
- State Senate District 24, PA (278,648)
- State Senate District 12, PA (263,696)
- State Senate District 10, PA (259,178)
Top 10 Neighboring 111th Congressional District (by Population) Neighboring 111th Congressional District on the Map
- Congressional District 15, PA (721,828)
- Congressional District 13, PA (674,188)
- Congressional District 8, PA (672,685)
Top 10 Neighboring Census Tract (by Population) Neighboring Census Tract on the Map
- Census Tract 1063, Bucks County, PA (7,069)
- Census Tract 1040, Bucks County, PA (6,574)
- Census Tract 1023, Bucks County, PA (5,706)
- Census Tract 1021.04, Bucks County, PA (5,702)
- Census Tract 1027, Bucks County, PA (5,198)
- Census Tract 1024.02, Bucks County, PA (4,618)
- Census Tract 2007.03, Montgomery County, PA (4,338)
- Census Tract 1042.04, Bucks County, PA (4,313)
- Census Tract 1025, Bucks County, PA (4,307)
- Census Tract 2072.02, Montgomery County, PA (4,116)
Top 10 Neighboring 5-Digit ZIP Code Tabulation Area (by Population) Neighboring 5-Digit ZIP Code Tabulation Area on the Map
- 18944, PA (24,479)
- 18914, PA (21,063)
- 18902, PA (20,973)
- 19440, PA (18,038)
- 18969, PA (15,273)
- 18964, PA (13,812)
- 18960, PA (12,473)
- 18917, PA (2,158)
- 18923, PA (998)
- 18962, PA (515)
Data
Demographic, Population, Households, and Housing Units
** Data sources from census 2010 **
Show Data on Map
Download Full List as CSV
Download Quick Sheet as CSV
| Subject | This Area | Bucks County | Pennsylvania | National |
|---|---|---|---|---|
| POPULATION | ||||
| Total Population Map | 15,029 | 625,249 | 12,702,379 | 308,745,538 |
| POPULATION, HISPANIC OR LATINO ORIGIN | ||||
| Not Hispanic or Latino Map | 14,601 | 598,467 | 11,982,719 | 258,267,944 |
| Hispanic or Latino Map | 428 | 26,782 | 719,660 | 50,477,594 |
| POPULATION, RACE | ||||
| White alone Map | 13,939 | 557,647 | 10,406,288 | 223,553,265 |
| Black or African American alone Map | 303 | 22,376 | 1,377,689 | 38,929,319 |
| American Indian and Alaska Native alone Map | 19 | 1,232 | 26,843 | 2,932,248 |
| Asian alone Map | 466 | 24,008 | 349,088 | 14,674,252 |
| Native Hawaiian and Other Pacific Islander alone Map | 8 | 174 | 3,653 | 540,013 |
| Some Other Race alone Map | 103 | 9,430 | 300,983 | 19,107,368 |
| Two or More Races Map | 191 | 10,382 | 237,835 | 9,009,073 |
| POPULATION, SEX | ||||
| Male Map | 7,410 | 306,663 | 6,190,363 | 151,781,326 |
| Female Map | 7,619 | 318,586 | 6,512,016 | 156,964,212 |
| POPULATION, AGE (18 YEARS) | ||||
| 18 years and over Map | 11,145 | 481,735 | 9,910,224 | 234,564,071 |
| Under 18 years | 3,884 | 143,514 | 2,792,155 | 74,181,467 |
| POPULATION, AGE | ||||
| Under 5 years | 954 | 34,150 | 729,538 | 20,201,362 |
| 5 to 9 years | 1,133 | 38,919 | 753,635 | 20,348,657 |
| 10 to 14 years | 1,122 | 43,070 | 791,151 | 20,677,194 |
| 15 to 17 years | 675 | 27,375 | 517,831 | 12,954,254 |
| 18 and 19 years | 324 | 14,349 | 387,235 | 9,086,089 |
| 20 years | 128 | 6,311 | 191,942 | 4,519,129 |
| 21 years | 135 | 6,057 | 183,257 | 4,354,294 |
| 22 to 24 years | 424 | 20,616 | 498,947 | 12,712,576 |
| 25 to 29 years | 636 | 33,575 | 781,527 | 21,101,849 |
| 30 to 34 years | 788 | 32,722 | 729,592 | 19,962,099 |
| 35 to 39 years | 1,055 | 37,785 | 764,287 | 20,179,642 |
| 40 to 44 years | 1,253 | 46,174 | 851,382 | 20,890,964 |
| 45 to 49 years | 1,325 | 54,629 | 955,763 | 22,708,591 |
| 50 to 54 years | 1,182 | 54,461 | 984,641 | 22,298,125 |
| 55 to 59 years | 1,008 | 46,067 | 879,048 | 19,664,805 |
| 60 and 61 years | 356 | 15,853 | 312,575 | 7,113,727 |
| 62 to 64 years | 509 | 21,917 | 430,721 | 9,704,197 |
| 65 and 66 years | 295 | 11,602 | 231,623 | 5,319,902 |
| 67 to 69 years | 391 | 15,750 | 321,379 | 7,115,361 |
| 70 to 74 years | 453 | 19,907 | 426,536 | 9,278,166 |
| 75 to 79 years | 355 | 16,735 | 362,332 | 7,317,795 |
| 80 to 84 years | 274 | 13,838 | 311,761 | 5,743,327 |
| 85 years and over | 254 | 13,387 | 305,676 | 5,493,433 |
| MEDIAN AGE BY SEX | ||||
| Both sexes Map | 40.60 | 42.00 | 40.10 | 37.20 |
| Male Map | 40.00 | 40.80 | 38.70 | 35.80 |
| Female Map | 41.10 | 43.10 | 41.50 | 38.50 |
| HOUSEHOLDS | ||||
| Total Households Map | 5,386 | 234,849 | 5,018,904 | 116,716,292 |
| HOUSEHOLDS, HOUSEHOLD TYPE | ||||
| Family households: Map | 4,169 | 168,665 | 3,261,307 | 77,538,296 |
| Husband-wife family Map | 3,527 | 136,531 | 2,417,765 | 56,510,377 |
| Other family: Map | 642 | 32,134 | 843,542 | 21,027,919 |
| Male householder, no wife present Map | 216 | 9,635 | 229,495 | 5,777,570 |
| Female householder, no husband present Map | 426 | 22,499 | 614,047 | 15,250,349 |
| Nonfamily households: Map | 1,217 | 66,184 | 1,757,597 | 39,177,996 |
| Householder living alone Map | 949 | 53,912 | 1,433,415 | 31,204,909 |
| Householder not living alone Map | 268 | 12,272 | 324,182 | 7,973,087 |
| HOUSEHOLDS, HISPANIC OR LATINO ORIGIN OF HOUSEHOLDER | ||||
| Not Hispanic or Latino householder: Map | 5,277 | 227,768 | 4,823,358 | 103,254,926 |
| Hispanic or Latino householder: Map | 109 | 7,081 | 195,546 | 13,461,366 |
| HOUSEHOLDS, RACE OF HOUSEHOLDER | ||||
| Householder who is White alone | 5,085 | 214,793 | 4,264,337 | 89,754,352 |
| Householder who is Black or African American alone | 103 | 8,015 | 498,966 | 14,129,983 |
| Householder who is American Indian and Alaska Native alone | 6 | 395 | 9,573 | 939,707 |
| Householder who is Asian alone | 125 | 6,904 | 109,060 | 4,632,164 |
| Householder who is Native Hawaiian and Other Pacific Islander alone | 2 | 42 | 1,127 | 143,932 |
| Householder who is Some Other Race alone | 28 | 2,536 | 82,237 | 4,916,427 |
| Householder who is Two or More Races | 37 | 2,164 | 53,604 | 2,199,727 |
| HOUSEHOLDS, HOUSEHOLD TYPE BY HOUSEHOLD SIZE | ||||
| Family households: Map | 4,169 | 168,665 | 3,261,307 | 77,538,296 |
| 2-person household Map | 1,651 | 67,714 | 1,442,819 | 31,882,616 |
| 3-person household Map | 877 | 40,019 | 767,169 | 17,765,829 |
| 4-person household Map | 999 | 36,776 | 620,755 | 15,214,075 |
| 5-person household Map | 445 | 16,206 | 271,611 | 7,411,997 |
| 6-person household Map | 147 | 5,401 | 98,268 | 3,026,278 |
| 7-or-more-person household Map | 50 | 2,549 | 60,685 | 2,237,501 |
| Nonfamily households: Map | 1,217 | 66,184 | 1,757,597 | 39,177,996 |
| 1-person household Map | 949 | 53,912 | 1,433,415 | 31,204,909 |
| 2-person household Map | 230 | 10,526 | 262,684 | 6,360,012 |
| 3-person household Map | 22 | 1,066 | 36,955 | 992,156 |
| 4-person household Map | 11 | 420 | 16,687 | 411,171 |
| 5-person household Map | 2 | 151 | 4,799 | 126,634 |
| 6-person household Map | 3 | 58 | 1,720 | 48,421 |
| 7-or-more-person household Map | 0 | 51 | 1,337 | 34,693 |
| HOUSING UNITS | ||||
| Total Housing Units Map | 5,574 | 245,956 | 5,567,315 | 131,704,730 |
| HOUSING UNITS, OCCUPANCY STATUS | ||||
| Occupied Map | 5,386 | 234,849 | 5,018,904 | 116,716,292 |
| Vacant Map | 188 | 11,107 | 548,411 | 14,988,438 |
| HOUSING UNITS, OCCUPIED, TENURE | ||||
| Owned with a mortgage or a loan Map | 3,179 | 133,103 | 2,268,674 | 52,979,430 |
| Owned free and clear Map | 1,154 | 47,910 | 1,223,048 | 23,006,644 |
| Renter occupied Map | 1,053 | 53,836 | 1,527,182 | 40,730,218 |
| HOUSING UNITS, VACANT, VACANCY STATUS | ||||
| For rent Map | 62 | 4,319 | 135,262 | 4,137,567 |
| Rented, not occupied Map | 8 | 266 | 9,386 | 206,825 |
| For sale only Map | 34 | 1,956 | 64,818 | 1,896,796 |
| Sold, not occupied Map | 15 | 610 | 20,131 | 421,032 |
| For seasonal, recreational, or occasional use Map | 14 | 1,536 | 161,582 | 4,649,298 |
| For migrant workers Map | 0 | 11 | 411 | 24,161 |
| Other vacant Map | 55 | 2,409 | 156,821 | 3,652,759 |
| HOUSING UNITS, OCCUPIED, AVERAGE HOUSEHOLD SIZE BY TENURE | ||||
| Total: Map | 2.78 | 2.63 | 2.45 | 2.58 |
| Owner occupied Map | 2.88 | 2.78 | 2.57 | 2.65 |
| Renter occupied Map | 2.36 | 2.11 | 2.16 | 2.44 |
| HOUSING UNITS, OCCUPIED, TENURE BY RACE OF HOUSEHOLDER | ||||
| Owner occupied: Map | 4,333 | 181,013 | 3,491,722 | 75,986,074 |
| Householder who is White alone Map | 4,141 | 170,902 | 3,140,005 | 63,446,275 |
| Householder who is Black or African American alone Map | 54 | 3,171 | 228,851 | 6,261,464 |
| Householder who is American Indian and Alaska Native alone Map | 3 | 202 | 4,562 | 509,588 |
| Householder who is Asian alone Map | 101 | 4,755 | 62,204 | 2,688,861 |
| Householder who is Native Hawaiian and Other Pacific Islander alone Map | 0 | 23 | 544 | 61,911 |
| Householder who is Some Other Race alone Map | 7 | 800 | 30,761 | 1,975,817 |
| Householder who is Two or More Races Map | 27 | 1,160 | 24,795 | 1,042,158 |
| Renter occupied: Map | 1,053 | 53,836 | 1,527,182 | 40,730,218 |
| Householder who is White alone Map | 944 | 43,891 | 1,124,332 | 26,308,077 |
| Householder who is Black or African American alone Map | 49 | 4,844 | 270,115 | 7,868,519 |
| Householder who is American Indian and Alaska Native alone Map | 3 | 193 | 5,011 | 430,119 |
| Householder who is Asian alone Map | 24 | 2,149 | 46,856 | 1,943,303 |
| Householder who is Native Hawaiian and Other Pacific Islander alone Map | 2 | 19 | 583 | 82,021 |
| Householder who is Some Other Race alone Map | 21 | 1,736 | 51,476 | 2,940,610 |
| Householder who is Two or More Races Map | 10 | 1,004 | 28,809 | 1,157,569 |
| HOUSING UNITS, OCCUPIED, TENURE BY HISPANIC OR LATINO ORIGIN OF HOUSEHOLDER | ||||
| Owner occupied: Map | 4,333 | 181,013 | 3,491,722 | 75,986,074 |
| Not Hispanic or Latino householder Map | 4,278 | 177,777 | 3,408,824 | 69,617,625 |
| Hispanic or Latino householder Map | 55 | 3,236 | 82,898 | 6,368,449 |
| Renter occupied: Map | 1,053 | 53,836 | 1,527,182 | 40,730,218 |
| Not Hispanic or Latino householder Map | 999 | 49,991 | 1,414,534 | 33,637,301 |
| Hispanic or Latino householder Map | 54 | 3,845 | 112,648 | 7,092,917 |
| HOUSING UNITS, OCCUPIED, TENURE BY HOUSEHOLD SIZE | ||||
| Owner occupied: Map | 4,333 | 181,013 | 3,491,722 | 75,986,074 |
| 1-person household Map | 615 | 30,762 | 767,169 | 16,453,569 |
| 2-person household Map | 1,534 | 63,149 | 1,304,206 | 27,618,605 |
| 3-person household Map | 737 | 33,665 | 596,731 | 12,517,563 |
| 4-person household Map | 891 | 32,444 | 499,363 | 10,998,793 |
| 5-person household Map | 382 | 14,225 | 210,370 | 5,057,765 |
| 6-person household Map | 129 | 4,631 | 72,113 | 1,965,796 |
| 7-or-more-person household Map | 45 | 2,137 | 41,770 | 1,373,983 |
| Renter occupied: Map | 1,053 | 53,836 | 1,527,182 | 40,730,218 |
| 1-person household Map | 334 | 23,150 | 666,246 | 14,751,340 |
| 2-person household Map | 347 | 15,091 | 401,297 | 10,624,023 |
| 3-person household Map | 162 | 7,420 | 207,393 | 6,240,422 |
| 4-person household Map | 119 | 4,752 | 138,079 | 4,626,453 |
| 5-person household Map | 65 | 2,132 | 66,040 | 2,480,866 |
| 6-person household Map | 21 | 828 | 27,875 | 1,108,903 |
| 7-or-more-person household Map | 5 | 463 | 20,252 | 898,211 |
Loading...