


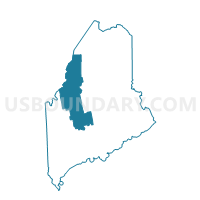
Somerset County, Maine
About
Outline

Summary
| Unique Area Identifier | 122138 |
| Name | Somerset County |
| State | Maine |
| Area (square miles) | 4,093.53 |
| Land Area (square miles) | 3,924.40 |
| Water Area (square miles) | 169.13 |
| % of Land Area | 95.87 |
| % of Water Area | 4.13 |
| Latitude of the Internal Point | 45.50748240 |
| Longtitude of the Internal Point | -69.97603950 |
| Total Population | 52,228 |
| Total Housing Units | 30,569 |
| Total Households | 21,927 |
| Median Age | 43.6 |
Maps
Graphs
Select a template below for downloading or customizing gragh for Somerset County, Maine


Neighbors
Neighoring County (by Name) Neighboring County on the Map
- Aroostook County, ME
- Franklin County, ME
- Kennebec County, ME
- Penobscot County, ME
- Piscataquis County, ME
- Waldo County, ME
County Subdivision in Somerset County (by Name) Neighboring County Subdivision on the Map
- Anson town, Somerset County, ME
- Athens town, Somerset County, ME
- Bingham town, Somerset County, ME
- Brighton plantation, Somerset County, ME
- Cambridge town, Somerset County, ME
- Canaan town, Somerset County, ME
- Caratunk town, Somerset County, ME
- Central Somerset UT, Somerset County, ME
- Cornville town, Somerset County, ME
- Dennistown plantation, Somerset County, ME
- Detroit town, Somerset County, ME
- Embden town, Somerset County, ME
- Fairfield town, Somerset County, ME
- Harmony town, Somerset County, ME
- Hartland town, Somerset County, ME
- Highland plantation, Somerset County, ME
- Jackman town, Somerset County, ME
- Madison town, Somerset County, ME
- Mercer town, Somerset County, ME
- Moose River town, Somerset County, ME
- Moscow town, Somerset County, ME
- New Portland town, Somerset County, ME
- Norridgewock town, Somerset County, ME
- Northeast Somerset UT, Somerset County, ME
- Northwest Somerset UT, Somerset County, ME
- Palmyra town, Somerset County, ME
- Pittsfield town, Somerset County, ME
- Pleasant Ridge plantation, Somerset County, ME
- Ripley town, Somerset County, ME
- Seboomook Lake UT, Somerset County, ME
- Skowhegan town, Somerset County, ME
- Smithfield town, Somerset County, ME
- Solon town, Somerset County, ME
- St. Albans town, Somerset County, ME
- Starks town, Somerset County, ME
- The Forks plantation, Somerset County, ME
- West Forks plantation, Somerset County, ME
Top 10 Neighboring Place (by Population) Neighboring Place on the Map
- Waterville city, ME (15,722)
- Winslow CDP, ME (7,794)
- Skowhegan CDP, ME (6,297)
- Pittsfield CDP, ME (3,150)
- Fairfield CDP, ME (2,638)
- Madison CDP, ME (2,630)
- Newport CDP, ME (1,776)
- Norridgewock CDP, ME (1,438)
- Hartland CDP, ME (813)
- Bingham CDP, ME (758)
Top 10 Neighboring Unified School District (by Population) Neighboring Unified School District on the Map
- Regional School Unit 18, ME (18,975)
- School Administrative District 09, ME (17,838)
- School Administrative District 54, ME (17,242)
- Waterville, ME (15,722)
- Regional School Unit 19, ME (15,053)
- School Administrative District 49, ME (14,994)
- School Administrative District 03, ME (10,767)
- Winslow, ME (7,794)
- School Administrative District 59, ME (6,584)
- School Administrative District 46, ME (6,580)
Top 10 Neighboring State Legislative District Lower Chamber (by Population) Neighboring State Legislative District Lower Chamber on the Map
- State House District 28, ME (9,362)
- State House District 25, ME (9,328)
- State House District 86, ME (9,275)
- State House District 45, ME (9,275)
- State House District 88, ME (9,250)
- State House District 78, ME (9,227)
- State House District 83, ME (9,119)
- State House District 91, ME (9,069)
- State House District 27, ME (8,919)
- State House District 87, ME (8,914)
Top 10 Neighboring State Legislative District Upper Chamber (by Population) Neighboring State Legislative District Upper Chamber on the Map
- State Senate District 33, ME (41,256)
- State Senate District 18, ME (38,950)
- State Senate District 23, ME (38,786)
- State Senate District 24, ME (38,252)
- State Senate District 26, ME (37,802)
- State Senate District 25, ME (36,885)
- State Senate District 27, ME (35,681)
- State Senate District 35, ME (35,119)
Top 10 Neighboring 111th Congressional District (by Population) Neighboring 111th Congressional District on the Map
Top 10 Census Tract in Somerset County (by Population) Neighboring Census Tract on the Map
- Census Tract 9668, Somerset County, ME (6,735)
- Census Tract 9665, Somerset County, ME (4,855)
- Census Tract 9667, Somerset County, ME (4,320)
- Census Tract 9666, Somerset County, ME (4,269)
- Census Tract 9660, Somerset County, ME (4,215)
- Census Tract 9661, Somerset County, ME (3,589)
- Census Tract 9669, Somerset County, ME (3,367)
- Census Tract 9657, Somerset County, ME (2,955)
- Census Tract 9658, Somerset County, ME (2,838)
- Census Tract 9664, Somerset County, ME (2,511)
Top 10 Neighboring 5-Digit ZIP Code Tabulation Area (by Population) Neighboring 5-Digit ZIP Code Tabulation Area on the Map
- 04901, ME (26,248)
- 04976, ME (9,903)
- 04938, ME (9,869)
- 04963, ME (7,238)
- 04937, ME (6,645)
- 04950, ME (4,855)
- 04930, ME (4,295)
- 04957, ME (4,265)
- 04967, ME (4,230)
- 04927, ME (3,486)
Data
Demographic, Population, Households, and Housing Units
** Data sources from census 2010 **
Show Data on Map
Download Full List as CSV
Download Quick Sheet as CSV
| Subject | This Area | Maine | National |
|---|---|---|---|
| POPULATION | |||
| Total Population Map | 52,228 | 1,328,361 | 308,745,538 |
| POPULATION, HISPANIC OR LATINO ORIGIN | |||
| Not Hispanic or Latino Map | 51,819 | 1,311,426 | 258,267,944 |
| Hispanic or Latino Map | 409 | 16,935 | 50,477,594 |
| POPULATION, RACE | |||
| White alone Map | 50,733 | 1,264,971 | 223,553,265 |
| Black or African American alone Map | 192 | 15,707 | 38,929,319 |
| American Indian and Alaska Native alone Map | 241 | 8,568 | 2,932,248 |
| Asian alone Map | 295 | 13,571 | 14,674,252 |
| Native Hawaiian and Other Pacific Islander alone Map | 13 | 342 | 540,013 |
| Some Other Race alone Map | 64 | 4,261 | 19,107,368 |
| Two or More Races Map | 690 | 20,941 | 9,009,073 |
| POPULATION, SEX | |||
| Male Map | 25,890 | 650,056 | 151,781,326 |
| Female Map | 26,338 | 678,305 | 156,964,212 |
| POPULATION, AGE (18 YEARS) | |||
| 18 years and over Map | 41,052 | 1,053,828 | 234,564,071 |
| Under 18 years | 11,176 | 274,533 | 74,181,467 |
| POPULATION, AGE | |||
| Under 5 years | 2,724 | 69,520 | 20,201,362 |
| 5 to 9 years | 2,980 | 74,116 | 20,348,657 |
| 10 to 14 years | 3,330 | 79,013 | 20,677,194 |
| 15 to 17 years | 2,142 | 51,884 | 12,954,254 |
| 18 and 19 years | 1,190 | 36,426 | 9,086,089 |
| 20 years | 502 | 17,408 | 4,519,129 |
| 21 years | 491 | 16,566 | 4,354,294 |
| 22 to 24 years | 1,449 | 45,672 | 12,712,576 |
| 25 to 29 years | 2,608 | 72,681 | 21,101,849 |
| 30 to 34 years | 2,772 | 71,943 | 19,962,099 |
| 35 to 39 years | 3,250 | 79,905 | 20,179,642 |
| 40 to 44 years | 3,791 | 91,471 | 20,890,964 |
| 45 to 49 years | 4,223 | 107,619 | 22,708,591 |
| 50 to 54 years | 4,456 | 110,956 | 22,298,125 |
| 55 to 59 years | 4,086 | 102,441 | 19,664,805 |
| 60 and 61 years | 1,532 | 37,823 | 7,113,727 |
| 62 to 64 years | 2,165 | 51,837 | 9,704,197 |
| 65 and 66 years | 1,157 | 28,116 | 5,319,902 |
| 67 to 69 years | 1,628 | 36,898 | 7,115,361 |
| 70 to 74 years | 2,015 | 47,637 | 9,278,166 |
| 75 to 79 years | 1,575 | 38,894 | 7,317,795 |
| 80 to 84 years | 1,160 | 30,399 | 5,743,327 |
| 85 years and over | 1,002 | 29,136 | 5,493,433 |
| MEDIAN AGE BY SEX | |||
| Both sexes Map | 43.60 | 42.70 | 37.20 |
| Male Map | 42.90 | 41.50 | 35.80 |
| Female Map | 44.30 | 43.80 | 38.50 |
| HOUSEHOLDS | |||
| Total Households Map | 21,927 | 557,219 | 116,716,292 |
| HOUSEHOLDS, HOUSEHOLD TYPE | |||
| Family households: Map | 14,353 | 350,621 | 77,538,296 |
| Husband-wife family Map | 10,898 | 270,088 | 56,510,377 |
| Other family: Map | 3,455 | 80,533 | 21,027,919 |
| Male householder, no wife present Map | 1,192 | 25,085 | 5,777,570 |
| Female householder, no husband present Map | 2,263 | 55,448 | 15,250,349 |
| Nonfamily households: Map | 7,574 | 206,598 | 39,177,996 |
| Householder living alone Map | 5,888 | 159,533 | 31,204,909 |
| Householder not living alone Map | 1,686 | 47,065 | 7,973,087 |
| HOUSEHOLDS, HISPANIC OR LATINO ORIGIN OF HOUSEHOLDER | |||
| Not Hispanic or Latino householder: Map | 21,825 | 552,753 | 103,254,926 |
| Hispanic or Latino householder: Map | 102 | 4,466 | 13,461,366 |
| HOUSEHOLDS, RACE OF HOUSEHOLDER | |||
| Householder who is White alone | 21,513 | 538,973 | 89,754,352 |
| Householder who is Black or African American alone | 49 | 4,260 | 14,129,983 |
| Householder who is American Indian and Alaska Native alone | 98 | 3,316 | 939,707 |
| Householder who is Asian alone | 48 | 3,655 | 4,632,164 |
| Householder who is Native Hawaiian and Other Pacific Islander alone | 3 | 98 | 143,932 |
| Householder who is Some Other Race alone | 21 | 1,129 | 4,916,427 |
| Householder who is Two or More Races | 195 | 5,788 | 2,199,727 |
| HOUSEHOLDS, HOUSEHOLD TYPE BY HOUSEHOLD SIZE | |||
| Family households: Map | 14,353 | 350,621 | 77,538,296 |
| 2-person household Map | 7,251 | 173,649 | 31,882,616 |
| 3-person household Map | 3,146 | 79,656 | 17,765,829 |
| 4-person household Map | 2,508 | 62,338 | 15,214,075 |
| 5-person household Map | 972 | 23,357 | 7,411,997 |
| 6-person household Map | 297 | 7,746 | 3,026,278 |
| 7-or-more-person household Map | 179 | 3,875 | 2,237,501 |
| Nonfamily households: Map | 7,574 | 206,598 | 39,177,996 |
| 1-person household Map | 5,888 | 159,533 | 31,204,909 |
| 2-person household Map | 1,502 | 40,046 | 6,360,012 |
| 3-person household Map | 129 | 4,684 | 992,156 |
| 4-person household Map | 39 | 1,672 | 411,171 |
| 5-person household Map | 10 | 483 | 126,634 |
| 6-person household Map | 4 | 108 | 48,421 |
| 7-or-more-person household Map | 2 | 72 | 34,693 |
| HOUSING UNITS | |||
| Total Housing Units Map | 30,569 | 721,830 | 131,704,730 |
| HOUSING UNITS, OCCUPANCY STATUS | |||
| Occupied Map | 21,927 | 557,219 | 116,716,292 |
| Vacant Map | 8,642 | 164,611 | 14,988,438 |
| HOUSING UNITS, OCCUPIED, TENURE | |||
| Owned with a mortgage or a loan Map | 9,946 | 264,218 | 52,979,430 |
| Owned free and clear Map | 6,831 | 133,199 | 23,006,644 |
| Renter occupied Map | 5,150 | 159,802 | 40,730,218 |
| HOUSING UNITS, VACANT, VACANCY STATUS | |||
| For rent Map | 563 | 15,738 | 4,137,567 |
| Rented, not occupied Map | 44 | 1,021 | 206,825 |
| For sale only Map | 454 | 9,711 | 1,896,796 |
| Sold, not occupied Map | 83 | 2,089 | 421,032 |
| For seasonal, recreational, or occasional use Map | 6,532 | 118,310 | 4,649,298 |
| For migrant workers Map | 17 | 160 | 24,161 |
| Other vacant Map | 949 | 17,582 | 3,652,759 |
| HOUSING UNITS, OCCUPIED, AVERAGE HOUSEHOLD SIZE BY TENURE | |||
| Total: Map | 2.35 | 2.32 | 2.58 |
| Owner occupied Map | 2.41 | 2.43 | 2.65 |
| Renter occupied Map | 2.16 | 2.04 | 2.44 |
| HOUSING UNITS, OCCUPIED, TENURE BY RACE OF HOUSEHOLDER | |||
| Owner occupied: Map | 16,777 | 397,417 | 75,986,074 |
| Householder who is White alone Map | 16,507 | 389,341 | 63,446,275 |
| Householder who is Black or African American alone Map | 20 | 1,026 | 6,261,464 |
| Householder who is American Indian and Alaska Native alone Map | 65 | 1,720 | 509,588 |
| Householder who is Asian alone Map | 35 | 1,943 | 2,688,861 |
| Householder who is Native Hawaiian and Other Pacific Islander alone Map | 2 | 40 | 61,911 |
| Householder who is Some Other Race alone Map | 14 | 437 | 1,975,817 |
| Householder who is Two or More Races Map | 134 | 2,910 | 1,042,158 |
| Renter occupied: Map | 5,150 | 159,802 | 40,730,218 |
| Householder who is White alone Map | 5,006 | 149,632 | 26,308,077 |
| Householder who is Black or African American alone Map | 29 | 3,234 | 7,868,519 |
| Householder who is American Indian and Alaska Native alone Map | 33 | 1,596 | 430,119 |
| Householder who is Asian alone Map | 13 | 1,712 | 1,943,303 |
| Householder who is Native Hawaiian and Other Pacific Islander alone Map | 1 | 58 | 82,021 |
| Householder who is Some Other Race alone Map | 7 | 692 | 2,940,610 |
| Householder who is Two or More Races Map | 61 | 2,878 | 1,157,569 |
| HOUSING UNITS, OCCUPIED, TENURE BY HISPANIC OR LATINO ORIGIN OF HOUSEHOLDER | |||
| Owner occupied: Map | 16,777 | 397,417 | 75,986,074 |
| Not Hispanic or Latino householder Map | 16,719 | 395,316 | 69,617,625 |
| Hispanic or Latino householder Map | 58 | 2,101 | 6,368,449 |
| Renter occupied: Map | 5,150 | 159,802 | 40,730,218 |
| Not Hispanic or Latino householder Map | 5,106 | 157,437 | 33,637,301 |
| Hispanic or Latino householder Map | 44 | 2,365 | 7,092,917 |
| HOUSING UNITS, OCCUPIED, TENURE BY HOUSEHOLD SIZE | |||
| Owner occupied: Map | 16,777 | 397,417 | 75,986,074 |
| 1-person household Map | 3,746 | 88,150 | 16,453,569 |
| 2-person household Map | 7,329 | 168,126 | 27,618,605 |
| 3-person household Map | 2,529 | 62,975 | 12,517,563 |
| 4-person household Map | 2,049 | 51,019 | 10,998,793 |
| 5-person household Map | 765 | 18,438 | 5,057,765 |
| 6-person household Map | 226 | 5,953 | 1,965,796 |
| 7-or-more-person household Map | 133 | 2,756 | 1,373,983 |
| Renter occupied: Map | 5,150 | 159,802 | 40,730,218 |
| 1-person household Map | 2,142 | 71,383 | 14,751,340 |
| 2-person household Map | 1,424 | 45,569 | 10,624,023 |
| 3-person household Map | 746 | 21,365 | 6,240,422 |
| 4-person household Map | 498 | 12,991 | 4,626,453 |
| 5-person household Map | 217 | 5,402 | 2,480,866 |
| 6-person household Map | 75 | 1,901 | 1,108,903 |
| 7-or-more-person household Map | 48 | 1,191 | 898,211 |
Loading...