


Worth County, Iowa
About
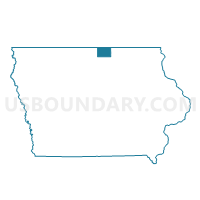
Outline

Summary
| Unique Area Identifier | 121641 |
| Name | Worth County |
| State | Iowa |
| Area (square miles) | 401.94 |
| Land Area (square miles) | 400.12 |
| Water Area (square miles) | 1.82 |
| % of Land Area | 99.55 |
| % of Water Area | 0.45 |
| Latitude of the Internal Point | 43.37349100 |
| Longtitude of the Internal Point | -93.24853320 |
| Total Population | 7,598 |
| Total Housing Units | 3,548 |
| Total Households | 3,172 |
| Median Age | 43.8 |
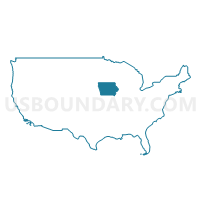
Maps
Graphs
Select a template below for downloading or customizing gragh for Worth County, Iowa


Neighbors
Neighoring County (by Name) Neighboring County on the Map
- Cerro Gordo County, IA
- Freeborn County, MN
- Hancock County, IA
- Mitchell County, IA
- Mower County, MN
- Winnebago County, IA
County Subdivision in Worth County (by Name) Neighboring County Subdivision on the Map
- Barton township, Worth County, IA
- Bristol township, Worth County, IA
- Brookfield township, Worth County, IA
- Danville township, Worth County, IA
- Deer Creek township, Worth County, IA
- Fertile township, Worth County, IA
- Grove township, Worth County, IA
- Hartland township, Worth County, IA
- Kensett township, Worth County, IA
- Lincoln township, Worth County, IA
- Silver Lake township, Worth County, IA
- Union township, Worth County, IA
Top 10 Neighboring Place (by Population) Neighboring Place on the Map
- Northwood city, IA (1,989)
- Manly city, IA (1,323)
- Emmons city, MN (391)
- Fertile city, IA (370)
- Kensett city, IA (266)
- Grafton city, IA (252)
- Hanlontown city, IA (226)
- Joice city, IA (222)
- Bolan CDP, IA (33)
Top 10 Neighboring Unified School District (by Population) Neighboring Unified School District on the Map
- Forest City Community School District, IA (6,814)
- Osage Community School District, IA (6,096)
- St. Ansgar Community School District, IA (3,987)
- Lake Mills Community School District, IA (3,888)
- Northwood-Kensett Community School District, IA (3,375)
- North Central Community School District, IA (3,018)
- Glenville-Emmons School District, MN (2,587)
- Nora Springs-Rock Falls Community School District, IA (2,466)
- Lyle Public School District, MN (1,144)
Top 10 Neighboring State Legislative District Lower Chamber (by Population) Neighboring State Legislative District Lower Chamber on the Map
- State House District 27A, MN (35,241)
- State House District 14, IA (28,299)
- State House District 12, IA (27,987)
- State House District 11, IA (27,572)
Top 10 Neighboring State Legislative District Upper Chamber (by Population) Neighboring State Legislative District Upper Chamber on the Map
- State Senate District 27, MN (72,647)
- State Senate District 7, IA (56,350)
- State Senate District 6, IA (55,559)
Top 10 Neighboring 111th Congressional District (by Population) Neighboring 111th Congressional District on the Map
Top 10 Census Tract in Worth County (by Population) Neighboring Census Tract on the Map
- Census Tract 6903, Worth County, IA (2,839)
- Census Tract 6901, Worth County, IA (2,442)
- Census Tract 6902, Worth County, IA (2,317)
Top 10 Neighboring 5-Digit ZIP Code Tabulation Area (by Population) Neighboring 5-Digit ZIP Code Tabulation Area on the Map
- 50401, IA (29,837)
- 50428, IA (9,384)
- 50436, IA (5,848)
- 50461, IA (5,613)
- 50459, IA (3,018)
- 50450, IA (2,897)
- 50472, IA (2,394)
- 56036, MN (1,959)
- 50456, IA (1,741)
- 55953, MN (894)
Data
Demographic, Population, Households, and Housing Units
** Data sources from census 2010 **
Show Data on Map
Download Full List as CSV
Download Quick Sheet as CSV
| Subject | This Area | Iowa | National |
|---|---|---|---|
| POPULATION | |||
| Total Population Map | 7,598 | 3,046,355 | 308,745,538 |
| POPULATION, HISPANIC OR LATINO ORIGIN | |||
| Not Hispanic or Latino Map | 7,451 | 2,894,811 | 258,267,944 |
| Hispanic or Latino Map | 147 | 151,544 | 50,477,594 |
| POPULATION, RACE | |||
| White alone Map | 7,435 | 2,781,561 | 223,553,265 |
| Black or African American alone Map | 27 | 89,148 | 38,929,319 |
| American Indian and Alaska Native alone Map | 14 | 11,084 | 2,932,248 |
| Asian alone Map | 24 | 53,094 | 14,674,252 |
| Native Hawaiian and Other Pacific Islander alone Map | 0 | 2,003 | 540,013 |
| Some Other Race alone Map | 31 | 56,132 | 19,107,368 |
| Two or More Races Map | 67 | 53,333 | 9,009,073 |
| POPULATION, SEX | |||
| Male Map | 3,786 | 1,508,319 | 151,781,326 |
| Female Map | 3,812 | 1,538,036 | 156,964,212 |
| POPULATION, AGE (18 YEARS) | |||
| 18 years and over Map | 5,841 | 2,318,362 | 234,564,071 |
| Under 18 years | 1,757 | 727,993 | 74,181,467 |
| POPULATION, AGE | |||
| Under 5 years | 414 | 202,123 | 20,201,362 |
| 5 to 9 years | 419 | 200,646 | 20,348,657 |
| 10 to 14 years | 554 | 200,904 | 20,677,194 |
| 15 to 17 years | 370 | 124,320 | 12,954,254 |
| 18 and 19 years | 184 | 92,517 | 9,086,089 |
| 20 years | 51 | 47,227 | 4,519,129 |
| 21 years | 58 | 44,695 | 4,354,294 |
| 22 to 24 years | 181 | 121,428 | 12,712,576 |
| 25 to 29 years | 410 | 197,843 | 21,101,849 |
| 30 to 34 years | 376 | 184,740 | 19,962,099 |
| 35 to 39 years | 432 | 177,148 | 20,179,642 |
| 40 to 44 years | 457 | 187,400 | 20,890,964 |
| 45 to 49 years | 599 | 216,482 | 22,708,591 |
| 50 to 54 years | 639 | 223,244 | 22,298,125 |
| 55 to 59 years | 578 | 204,393 | 19,664,805 |
| 60 and 61 years | 218 | 72,152 | 7,113,727 |
| 62 to 64 years | 268 | 96,205 | 9,704,197 |
| 65 and 66 years | 167 | 52,304 | 5,319,902 |
| 67 to 69 years | 207 | 72,061 | 7,115,361 |
| 70 to 74 years | 306 | 100,291 | 9,278,166 |
| 75 to 79 years | 253 | 83,387 | 7,317,795 |
| 80 to 84 years | 206 | 70,187 | 5,743,327 |
| 85 years and over | 251 | 74,658 | 5,493,433 |
| MEDIAN AGE BY SEX | |||
| Both sexes Map | 43.80 | 38.10 | 37.20 |
| Male Map | 43.30 | 36.60 | 35.80 |
| Female Map | 44.50 | 39.50 | 38.50 |
| HOUSEHOLDS | |||
| Total Households Map | 3,172 | 1,221,576 | 116,716,292 |
| HOUSEHOLDS, HOUSEHOLD TYPE | |||
| Family households: Map | 2,149 | 790,034 | 77,538,296 |
| Husband-wife family Map | 1,775 | 625,173 | 56,510,377 |
| Other family: Map | 374 | 164,861 | 21,027,919 |
| Male householder, no wife present Map | 139 | 51,105 | 5,777,570 |
| Female householder, no husband present Map | 235 | 113,756 | 15,250,349 |
| Nonfamily households: Map | 1,023 | 431,542 | 39,177,996 |
| Householder living alone Map | 872 | 347,479 | 31,204,909 |
| Householder not living alone Map | 151 | 84,063 | 7,973,087 |
| HOUSEHOLDS, HISPANIC OR LATINO ORIGIN OF HOUSEHOLDER | |||
| Not Hispanic or Latino householder: Map | 3,131 | 1,184,389 | 103,254,926 |
| Hispanic or Latino householder: Map | 41 | 37,187 | 13,461,366 |
| HOUSEHOLDS, RACE OF HOUSEHOLDER | |||
| Householder who is White alone | 3,142 | 1,147,691 | 89,754,352 |
| Householder who is Black or African American alone | 2 | 29,305 | 14,129,983 |
| Householder who is American Indian and Alaska Native alone | 1 | 3,414 | 939,707 |
| Householder who is Asian alone | 4 | 15,860 | 4,632,164 |
| Householder who is Native Hawaiian and Other Pacific Islander alone | 0 | 476 | 143,932 |
| Householder who is Some Other Race alone | 8 | 14,481 | 4,916,427 |
| Householder who is Two or More Races | 15 | 10,349 | 2,199,727 |
| HOUSEHOLDS, HOUSEHOLD TYPE BY HOUSEHOLD SIZE | |||
| Family households: Map | 2,149 | 790,034 | 77,538,296 |
| 2-person household Map | 1,116 | 379,328 | 31,882,616 |
| 3-person household Map | 416 | 162,734 | 17,765,829 |
| 4-person household Map | 384 | 142,197 | 15,214,075 |
| 5-person household Map | 160 | 68,261 | 7,411,997 |
| 6-person household Map | 55 | 24,263 | 3,026,278 |
| 7-or-more-person household Map | 18 | 13,251 | 2,237,501 |
| Nonfamily households: Map | 1,023 | 431,542 | 39,177,996 |
| 1-person household Map | 872 | 347,479 | 31,204,909 |
| 2-person household Map | 128 | 66,548 | 6,360,012 |
| 3-person household Map | 12 | 10,678 | 992,156 |
| 4-person household Map | 5 | 5,088 | 411,171 |
| 5-person household Map | 4 | 1,269 | 126,634 |
| 6-person household Map | 0 | 316 | 48,421 |
| 7-or-more-person household Map | 2 | 164 | 34,693 |
| HOUSING UNITS | |||
| Total Housing Units Map | 3,548 | 1,336,417 | 131,704,730 |
| HOUSING UNITS, OCCUPANCY STATUS | |||
| Occupied Map | 3,172 | 1,221,576 | 116,716,292 |
| Vacant Map | 376 | 114,841 | 14,988,438 |
| HOUSING UNITS, OCCUPIED, TENURE | |||
| Owned with a mortgage or a loan Map | 1,429 | 573,988 | 52,979,430 |
| Owned free and clear Map | 1,102 | 306,647 | 23,006,644 |
| Renter occupied Map | 641 | 340,941 | 40,730,218 |
| HOUSING UNITS, VACANT, VACANCY STATUS | |||
| For rent Map | 75 | 31,812 | 4,137,567 |
| Rented, not occupied Map | 7 | 1,803 | 206,825 |
| For sale only Map | 75 | 18,405 | 1,896,796 |
| Sold, not occupied Map | 13 | 5,555 | 421,032 |
| For seasonal, recreational, or occasional use Map | 34 | 21,020 | 4,649,298 |
| For migrant workers Map | 0 | 87 | 24,161 |
| Other vacant Map | 172 | 36,159 | 3,652,759 |
| HOUSING UNITS, OCCUPIED, AVERAGE HOUSEHOLD SIZE BY TENURE | |||
| Total: Map | 2.37 | 2.41 | 2.58 |
| Owner occupied Map | 2.44 | 2.52 | 2.65 |
| Renter occupied Map | 2.08 | 2.14 | 2.44 |
| HOUSING UNITS, OCCUPIED, TENURE BY RACE OF HOUSEHOLDER | |||
| Owner occupied: Map | 2,531 | 880,635 | 75,986,074 |
| Householder who is White alone Map | 2,512 | 849,767 | 63,446,275 |
| Householder who is Black or African American alone Map | 1 | 9,110 | 6,261,464 |
| Householder who is American Indian and Alaska Native alone Map | 1 | 1,585 | 509,588 |
| Householder who is Asian alone Map | 3 | 8,306 | 2,688,861 |
| Householder who is Native Hawaiian and Other Pacific Islander alone Map | 0 | 160 | 61,911 |
| Householder who is Some Other Race alone Map | 6 | 6,837 | 1,975,817 |
| Householder who is Two or More Races Map | 8 | 4,870 | 1,042,158 |
| Renter occupied: Map | 641 | 340,941 | 40,730,218 |
| Householder who is White alone Map | 630 | 297,924 | 26,308,077 |
| Householder who is Black or African American alone Map | 1 | 20,195 | 7,868,519 |
| Householder who is American Indian and Alaska Native alone Map | 0 | 1,829 | 430,119 |
| Householder who is Asian alone Map | 1 | 7,554 | 1,943,303 |
| Householder who is Native Hawaiian and Other Pacific Islander alone Map | 0 | 316 | 82,021 |
| Householder who is Some Other Race alone Map | 2 | 7,644 | 2,940,610 |
| Householder who is Two or More Races Map | 7 | 5,479 | 1,157,569 |
| HOUSING UNITS, OCCUPIED, TENURE BY HISPANIC OR LATINO ORIGIN OF HOUSEHOLDER | |||
| Owner occupied: Map | 2,531 | 880,635 | 75,986,074 |
| Not Hispanic or Latino householder Map | 2,500 | 861,741 | 69,617,625 |
| Hispanic or Latino householder Map | 31 | 18,894 | 6,368,449 |
| Renter occupied: Map | 641 | 340,941 | 40,730,218 |
| Not Hispanic or Latino householder Map | 631 | 322,648 | 33,637,301 |
| Hispanic or Latino householder Map | 10 | 18,293 | 7,092,917 |
| HOUSING UNITS, OCCUPIED, TENURE BY HOUSEHOLD SIZE | |||
| Owner occupied: Map | 2,531 | 880,635 | 75,986,074 |
| 1-person household Map | 575 | 197,923 | 16,453,569 |
| 2-person household Map | 1,090 | 355,975 | 27,618,605 |
| 3-person household Map | 335 | 127,879 | 12,517,563 |
| 4-person household Map | 336 | 115,932 | 10,998,793 |
| 5-person household Map | 134 | 54,480 | 5,057,765 |
| 6-person household Map | 45 | 18,720 | 1,965,796 |
| 7-or-more-person household Map | 16 | 9,726 | 1,373,983 |
| Renter occupied: Map | 641 | 340,941 | 40,730,218 |
| 1-person household Map | 297 | 149,556 | 14,751,340 |
| 2-person household Map | 154 | 89,901 | 10,624,023 |
| 3-person household Map | 93 | 45,533 | 6,240,422 |
| 4-person household Map | 53 | 31,353 | 4,626,453 |
| 5-person household Map | 30 | 15,050 | 2,480,866 |
| 6-person household Map | 10 | 5,859 | 1,108,903 |
| 7-or-more-person household Map | 4 | 3,689 | 898,211 |
Loading...