


Nassau County, New York
About
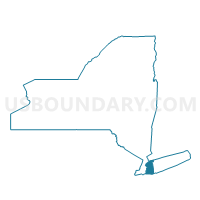
Outline

Summary
| Unique Area Identifier | 119983 |
| Name | Nassau County |
| State | New York |
| Area (square miles) | 453.23 |
| Land Area (square miles) | 284.72 |
| Water Area (square miles) | 168.52 |
| % of Land Area | 62.82 |
| % of Water Area | 37.18 |
| Latitude of the Internal Point | 40.72968700 |
| Longtitude of the Internal Point | -73.58938440 |
| Total Population | 1,339,532 |
| Total Housing Units | 468,346 |
| Total Households | 448,528 |
| Median Age | 41.1 |
Maps
Graphs
Select a template below for downloading or customizing gragh for Nassau County, New York


Neighbors
Neighoring County (by Name) Neighboring County on the Map
County Subdivision in Nassau County (by Name) Neighboring County Subdivision on the Map
- Glen Cove city, Nassau County, NY
- Hempstead town, Nassau County, NY
- Long Beach city, Nassau County, NY
- North Hempstead town, Nassau County, NY
- Oyster Bay town, Nassau County, NY
Top 10 Neighboring Place (by Population) Neighboring Place on the Map
- New York city, NY (8,175,133)
- Stamford city, CT (122,643)
- New Rochelle city, NY (77,062)
- Hempstead village, NY (53,891)
- Levittown CDP, NY (51,881)
- Freeport village, NY (42,860)
- Hicksville CDP, NY (41,547)
- East Meadow CDP, NY (38,132)
- Valley Stream village, NY (37,511)
- Long Beach city, NY (33,275)
Top 10 Neighboring Elementary School District (by Population) Neighboring Elementary School District on the Map
- Elmont Union Free School District, NY (50,010)
- Valley Stream Union Free School District 13, NY (28,276)
- North Bellmore Union Free School District, NY (26,085)
- Franklin Square Union Free School District, NY (25,069)
- New Hyde Park-Garden City Park Union Free School District, NY (22,808)
- Floral Park-Bellerose Union Free School District, NY (20,078)
- Merrick Union Free School District, NY (17,964)
- Valley Stream Union Free School District 30, NY (17,623)
- North Merrick Union Free School District, NY (14,055)
- Valley Stream Union Free School District 24, NY (13,866)
Top 10 Neighboring Secondary School District (by Population) Neighboring Secondary School District on the Map
- Sewanhaka Central High School District, NY (117,965)
- Bellmore-Merrick Central High School District, NY (70,643)
- Valley Stream Central High School District, NY (59,765)
Top 10 Neighboring Unified School District (by Population) Neighboring Unified School District on the Map
- New York City Department Of Education, NY (8,175,133)
- Stamford School District, CT (122,643)
- New Rochelle City School District, NY (77,062)
- Greenwich School District, CT (61,171)
- East Meadow Union Free School District, NY (52,102)
- Half Hollow Hills Central School District, NY (48,558)
- Massapequa Union Free School District, NY (47,145)
- Levittown Union Free School District, NY (46,540)
- Great Neck Union Free School District, NY (44,580)
- Hempstead Union Free School District, NY (44,278)
Top 10 Neighboring State Legislative District Lower Chamber (by Population) Neighboring State Legislative District Lower Chamber on the Map
- Assembly District 10, NY (138,509)
- Assembly District 17, NY (136,600)
- Assembly District 15, NY (135,528)
- Assembly District 11, NY (135,087)
- Assembly District 16, NY (134,747)
- Assembly District 21, NY (132,039)
- Assembly District 13, NY (131,694)
- Assembly District 14, NY (131,344)
- Assembly District 31, NY (131,083)
- Assembly District 18, NY (130,690)
Top 10 Neighboring State Legislative District Upper Chamber (by Population) Neighboring State Legislative District Upper Chamber on the Map
- State Senate District 37, NY (326,645)
- State Senate District 14, NY (323,939)
- State Senate District 11, NY (320,102)
- State Senate District 5, NY (316,844)
- State Senate District 34, NY (315,408)
- State Senate District 10, NY (314,840)
- State Senate District 7, NY (311,141)
- State Senate District 4, NY (309,135)
- State Senate District 6, NY (307,789)
- State Senate District 8, NY (305,226)
Top 10 Neighboring 111th Congressional District (by Population) Neighboring 111th Congressional District on the Map
- Congressional District 4, CT (706,740)
- Congressional District 2, NY (679,893)
- Congressional District 18, NY (674,825)
- Congressional District 5, NY (670,130)
- Congressional District 7, NY (667,632)
- Congressional District 4, NY (663,407)
- Congressional District 9, NY (660,306)
- Congressional District 6, NY (651,764)
- Congressional District 3, NY (645,508)
Top 10 Census Tract in Nassau County (by Population) Neighboring Census Tract on the Map
- Census Tract 5172, Nassau County, NY (8,058)
- Census Tract 3009, Nassau County, NY (8,009)
- Census Tract 4051, Nassau County, NY (7,823)
- Census Tract 4099, Nassau County, NY (7,787)
- Census Tract 5177.01, Nassau County, NY (7,636)
- Census Tract 4054, Nassau County, NY (7,562)
- Census Tract 4139, Nassau County, NY (7,536)
- Census Tract 4135, Nassau County, NY (7,362)
- Census Tract 4069, Nassau County, NY (7,272)
- Census Tract 4106, Nassau County, NY (7,195)
Top 10 Neighboring 5-Digit ZIP Code Tabulation Area (by Population) Neighboring 5-Digit ZIP Code Tabulation Area on the Map
- 11691, NY (60,035)
- 11550, NY (56,435)
- 11758, NY (53,804)
- 11590, NY (45,768)
- 11520, NY (43,341)
- 11756, NY (42,791)
- 11743, NY (42,230)
- 11003, NY (41,356)
- 11040, NY (40,782)
- 11580, NY (40,113)
Data
Demographic, Population, Households, and Housing Units
** Data sources from census 2010 **
Show Data on Map
Download Full List as CSV
Download Quick Sheet as CSV
| Subject | This Area | New York | National |
|---|---|---|---|
| POPULATION | |||
| Total Population Map | 1,339,532 | 19,378,102 | 308,745,538 |
| POPULATION, HISPANIC OR LATINO ORIGIN | |||
| Not Hispanic or Latino Map | 1,144,177 | 15,961,180 | 258,267,944 |
| Hispanic or Latino Map | 195,355 | 3,416,922 | 50,477,594 |
| POPULATION, RACE | |||
| White alone Map | 977,577 | 12,740,974 | 223,553,265 |
| Black or African American alone Map | 149,049 | 3,073,800 | 38,929,319 |
| American Indian and Alaska Native alone Map | 3,185 | 106,906 | 2,932,248 |
| Asian alone Map | 102,266 | 1,420,244 | 14,674,252 |
| Native Hawaiian and Other Pacific Islander alone Map | 336 | 8,766 | 540,013 |
| Some Other Race alone Map | 75,211 | 1,441,563 | 19,107,368 |
| Two or More Races Map | 31,908 | 585,849 | 9,009,073 |
| POPULATION, SEX | |||
| Male Map | 647,978 | 9,377,147 | 151,781,326 |
| Female Map | 691,554 | 10,000,955 | 156,964,212 |
| POPULATION, AGE (18 YEARS) | |||
| 18 years and over Map | 1,027,952 | 15,053,173 | 234,564,071 |
| Under 18 years | 311,580 | 4,324,929 | 74,181,467 |
| POPULATION, AGE | |||
| Under 5 years | 73,888 | 1,155,822 | 20,201,362 |
| 5 to 9 years | 83,405 | 1,163,955 | 20,348,657 |
| 10 to 14 years | 93,607 | 1,211,456 | 20,677,194 |
| 15 to 17 years | 60,680 | 793,696 | 12,954,254 |
| 18 and 19 years | 33,390 | 572,582 | 9,086,089 |
| 20 years | 16,433 | 293,083 | 4,519,129 |
| 21 years | 15,515 | 281,596 | 4,354,294 |
| 22 to 24 years | 47,428 | 836,256 | 12,712,576 |
| 25 to 29 years | 71,252 | 1,380,177 | 21,101,849 |
| 30 to 34 years | 71,304 | 1,279,160 | 19,962,099 |
| 35 to 39 years | 80,583 | 1,254,124 | 20,179,642 |
| 40 to 44 years | 97,049 | 1,355,893 | 20,890,964 |
| 45 to 49 years | 109,918 | 1,458,763 | 22,708,591 |
| 50 to 54 years | 108,067 | 1,419,928 | 22,298,125 |
| 55 to 59 years | 93,403 | 1,237,408 | 19,664,805 |
| 60 and 61 years | 33,471 | 453,993 | 7,113,727 |
| 62 to 64 years | 45,458 | 612,267 | 9,704,197 |
| 65 and 66 years | 23,743 | 330,160 | 5,319,902 |
| 67 to 69 years | 31,836 | 443,051 | 7,115,361 |
| 70 to 74 years | 42,728 | 587,391 | 9,278,166 |
| 75 to 79 years | 37,942 | 474,807 | 7,317,795 |
| 80 to 84 years | 34,375 | 391,660 | 5,743,327 |
| 85 years and over | 34,057 | 390,874 | 5,493,433 |
| MEDIAN AGE BY SEX | |||
| Both sexes Map | 41.10 | 38.00 | 37.20 |
| Male Map | 39.50 | 36.30 | 35.80 |
| Female Map | 42.70 | 39.40 | 38.50 |
| HOUSEHOLDS | |||
| Total Households Map | 448,528 | 7,317,755 | 116,716,292 |
| HOUSEHOLDS, HOUSEHOLD TYPE | |||
| Family households: Map | 340,523 | 4,649,791 | 77,538,296 |
| Husband-wife family Map | 269,043 | 3,192,903 | 56,510,377 |
| Other family: Map | 71,480 | 1,456,888 | 21,027,919 |
| Male householder, no wife present Map | 19,088 | 366,948 | 5,777,570 |
| Female householder, no husband present Map | 52,392 | 1,089,940 | 15,250,349 |
| Nonfamily households: Map | 108,005 | 2,667,964 | 39,177,996 |
| Householder living alone Map | 90,292 | 2,130,670 | 31,204,909 |
| Householder not living alone Map | 17,713 | 537,294 | 7,973,087 |
| HOUSEHOLDS, HISPANIC OR LATINO ORIGIN OF HOUSEHOLDER | |||
| Not Hispanic or Latino householder: Map | 403,960 | 6,311,241 | 103,254,926 |
| Hispanic or Latino householder: Map | 44,568 | 1,006,514 | 13,461,366 |
| HOUSEHOLDS, RACE OF HOUSEHOLDER | |||
| Householder who is White alone | 353,551 | 5,169,163 | 89,754,352 |
| Householder who is Black or African American alone | 43,735 | 1,095,790 | 14,129,983 |
| Householder who is American Indian and Alaska Native alone | 733 | 33,824 | 939,707 |
| Householder who is Asian alone | 27,342 | 445,652 | 4,632,164 |
| Householder who is Native Hawaiian and Other Pacific Islander alone | 76 | 2,615 | 143,932 |
| Householder who is Some Other Race alone | 15,875 | 405,320 | 4,916,427 |
| Householder who is Two or More Races | 7,216 | 165,391 | 2,199,727 |
| HOUSEHOLDS, HOUSEHOLD TYPE BY HOUSEHOLD SIZE | |||
| Family households: Map | 340,523 | 4,649,791 | 77,538,296 |
| 2-person household Map | 113,285 | 1,785,206 | 31,882,616 |
| 3-person household Map | 77,508 | 1,109,716 | 17,765,829 |
| 4-person household Map | 80,219 | 944,590 | 15,214,075 |
| 5-person household Map | 40,700 | 461,667 | 7,411,997 |
| 6-person household Map | 15,982 | 189,577 | 3,026,278 |
| 7-or-more-person household Map | 12,829 | 159,035 | 2,237,501 |
| Nonfamily households: Map | 108,005 | 2,667,964 | 39,177,996 |
| 1-person household Map | 90,292 | 2,130,670 | 31,204,909 |
| 2-person household Map | 13,994 | 430,564 | 6,360,012 |
| 3-person household Map | 1,981 | 66,787 | 992,156 |
| 4-person household Map | 896 | 24,877 | 411,171 |
| 5-person household Map | 399 | 8,596 | 126,634 |
| 6-person household Map | 227 | 3,400 | 48,421 |
| 7-or-more-person household Map | 216 | 3,070 | 34,693 |
| HOUSING UNITS | |||
| Total Housing Units Map | 468,346 | 8,108,103 | 131,704,730 |
| HOUSING UNITS, OCCUPANCY STATUS | |||
| Occupied Map | 448,528 | 7,317,755 | 116,716,292 |
| Vacant Map | 19,818 | 790,348 | 14,988,438 |
| HOUSING UNITS, OCCUPIED, TENURE | |||
| Owned with a mortgage or a loan Map | 243,840 | 2,610,123 | 52,979,430 |
| Owned free and clear Map | 114,460 | 1,287,714 | 23,006,644 |
| Renter occupied Map | 90,228 | 3,419,918 | 40,730,218 |
| HOUSING UNITS, VACANT, VACANCY STATUS | |||
| For rent Map | 4,557 | 200,039 | 4,137,567 |
| Rented, not occupied Map | 374 | 12,786 | 206,825 |
| For sale only Map | 4,361 | 77,225 | 1,896,796 |
| Sold, not occupied Map | 1,298 | 21,027 | 421,032 |
| For seasonal, recreational, or occasional use Map | 4,073 | 289,301 | 4,649,298 |
| For migrant workers Map | 3 | 892 | 24,161 |
| Other vacant Map | 5,152 | 189,078 | 3,652,759 |
| HOUSING UNITS, OCCUPIED, AVERAGE HOUSEHOLD SIZE BY TENURE | |||
| Total: Map | 2.94 | 2.57 | 2.58 |
| Owner occupied Map | 3.03 | 2.71 | 2.65 |
| Renter occupied Map | 2.58 | 2.41 | 2.44 |
| HOUSING UNITS, OCCUPIED, TENURE BY RACE OF HOUSEHOLDER | |||
| Owner occupied: Map | 358,300 | 3,897,837 | 75,986,074 |
| Householder who is White alone Map | 295,219 | 3,237,592 | 63,446,275 |
| Householder who is Black or African American alone Map | 28,362 | 325,395 | 6,261,464 |
| Householder who is American Indian and Alaska Native alone Map | 401 | 11,250 | 509,588 |
| Householder who is Asian alone Map | 22,121 | 197,011 | 2,688,861 |
| Householder who is Native Hawaiian and Other Pacific Islander alone Map | 35 | 741 | 61,911 |
| Householder who is Some Other Race alone Map | 7,468 | 74,243 | 1,975,817 |
| Householder who is Two or More Races Map | 4,694 | 51,605 | 1,042,158 |
| Renter occupied: Map | 90,228 | 3,419,918 | 40,730,218 |
| Householder who is White alone Map | 58,332 | 1,931,571 | 26,308,077 |
| Householder who is Black or African American alone Map | 15,373 | 770,395 | 7,868,519 |
| Householder who is American Indian and Alaska Native alone Map | 332 | 22,574 | 430,119 |
| Householder who is Asian alone Map | 5,221 | 248,641 | 1,943,303 |
| Householder who is Native Hawaiian and Other Pacific Islander alone Map | 41 | 1,874 | 82,021 |
| Householder who is Some Other Race alone Map | 8,407 | 331,077 | 2,940,610 |
| Householder who is Two or More Races Map | 2,522 | 113,786 | 1,157,569 |
| HOUSING UNITS, OCCUPIED, TENURE BY HISPANIC OR LATINO ORIGIN OF HOUSEHOLDER | |||
| Owner occupied: Map | 358,300 | 3,897,837 | 75,986,074 |
| Not Hispanic or Latino householder Map | 333,678 | 3,664,784 | 69,617,625 |
| Hispanic or Latino householder Map | 24,622 | 233,053 | 6,368,449 |
| Renter occupied: Map | 90,228 | 3,419,918 | 40,730,218 |
| Not Hispanic or Latino householder Map | 70,282 | 2,646,457 | 33,637,301 |
| Hispanic or Latino householder Map | 19,946 | 773,461 | 7,092,917 |
| HOUSING UNITS, OCCUPIED, TENURE BY HOUSEHOLD SIZE | |||
| Owner occupied: Map | 358,300 | 3,897,837 | 75,986,074 |
| 1-person household Map | 58,809 | 860,611 | 16,453,569 |
| 2-person household Map | 104,827 | 1,304,752 | 27,618,605 |
| 3-person household Map | 65,788 | 660,251 | 12,517,563 |
| 4-person household Map | 70,305 | 606,580 | 10,998,793 |
| 5-person household Map | 35,213 | 279,929 | 5,057,765 |
| 6-person household Map | 13,432 | 106,323 | 1,965,796 |
| 7-or-more-person household Map | 9,926 | 79,391 | 1,373,983 |
| Renter occupied: Map | 90,228 | 3,419,918 | 40,730,218 |
| 1-person household Map | 31,483 | 1,270,059 | 14,751,340 |
| 2-person household Map | 22,452 | 911,018 | 10,624,023 |
| 3-person household Map | 13,701 | 516,252 | 6,240,422 |
| 4-person household Map | 10,810 | 362,887 | 4,626,453 |
| 5-person household Map | 5,886 | 190,334 | 2,480,866 |
| 6-person household Map | 2,777 | 86,654 | 1,108,903 |
| 7-or-more-person household Map | 3,119 | 82,714 | 898,211 |
Loading...